Concomitant and decoupled effects of cigarette smoke and SCAL1 upregulation on oncogenic phenotypes and ROS detoxification in lung adenocarcinoma ...
←
→
Page content transcription
If your browser does not render page correctly, please read the page content below
www.nature.com/scientificreports
OPEN Concomitant and decoupled effects
of cigarette smoke and SCAL1
upregulation on oncogenic
phenotypes and ROS detoxification
in lung adenocarcinoma cells
Carmela Rieline V. Cruz1,2,3, Jose Lorenzo M. Ferrer1,3 & Reynaldo L. Garcia1*
Lung cancer is the leading cause of cancer deaths worldwide, with smoking as its primary predisposing
factor. Although carcinogens in cigarettes are known to cause oncogenic DNA alterations, analyses
of patient cohorts revealed heterogeneous genetic aberrations with no clear driver mutations.
The contribution of noncoding RNAs (ncRNAs) in the pathogenesis of lung cancer has since been
demonstrated. Their dysregulation has been linked to cancer initiation and progression. A novel
long noncoding RNA (lncRNA) called smoke and cancer-associated lncRNA 1 (SCAL1) was recently
found upregulated in smoke-exposed adenocarcinomic alveolar epithelial cells. The present study
characterized the phenotypic consequences of SCAL1 overexpression and knockdown using A549
cells as model system, with or without prior exposure to cigarette smoke extract (CSE). Increase
in SCAL1 levels either by CSE treatment or SCAL1 overexpression led to increased cell migration,
extensive cytoskeletal remodeling, and resistance to apoptosis. Further, SCAL1 levels were negatively
correlated with intracellular levels of reactive oxygen species (ROS). In contrast, SCAL1 knockdown
showed converse results for these assays. These results confirm the oncogenic function of SCAL1 and
its role as a CSE-activated lncRNA that mediates ROS detoxification in A549 cells, thereby allowing
them to develop resistance to and survive smoke-induced toxicity.
Smoking is the number one predisposing factor for lung o ncogenesis1. A significant proportion of lung cancer
deaths is attributable to smoking—around 80% of patients in the United States and France, 61% of patients in
Asia, and 40% of patients in sub-Saharan Africa2. Genome-wide analyses of expression patterns in adenocarci-
nomas reveal divergence in both genomic and transcriptomic landscapes between tumors that arise in smokers
and never-smokers. In general, tumors obtained from never-smokers are characteristically less aggressive than
those found in s mokers1.
Although smoking is established as a driver of lung oncogenesis, molecular mechanisms that ultimately
lead to an aggressive neoplastic phenotype remain unclear. It has been hypothesized that chronic exposure of
pulmonary DNA to metabolically active carcinogens present in cigarettes result in DNA adducts and genetic
lesions that may lead to carcinogenesis3. Although genetic alterations brought about by smoke-induced injury
may be the cause of lung carcinomas, the mutations are heterogeneous across patient cohorts and it is difficult
to identify driver mutations that are responsible for disease onset. Further, mutations in oncogenes and tumor
suppressors may not be solely responsible for cancer of the lung. In recent years, non-coding RNAs including
microRNAs, lncRNAs and circular RNAs, have been implicated in many cancer types. In lung cancer tissues, the
cancer-associated region long noncoding RNA 5 (CARLo5)4, Differentiation antagonizing non-protein coding
RNA (DANCR)5, 6, antisense non-coding RNA in the INK4 locus (ANRIL)7, lncRNA H 198, and colon cancer-
associated transcript 2 (CCAT2)9, were found to be upregulated; while the BRAF-activated non-coding RNA
(BANCR)10, maternally expressed gene 3 (MEG3)11, and taurine upregulated gene1 (TUG1)12 were shown to be
downregulated. More recently, a study by Thai and colleagues revealed highly elevated levels of an lncRNA that
1
Disease Molecular Biology and Epigenetics Laboratory, National Institute of Molecular Biology and Biotechnology,
University of the Philippines Diliman, 1101 Quezon City, Philippines. 2Department of Developmental Biology,
International Max Planck Research School, Justus‑von‑Liebig‑Weg 11, 37077 Göttingen, Germany. 3These authors
contributed equally: Carmela Rieline V. Cruz and Jose Lorenzo M. Ferrer. *email: reygarcia@mbb.upd.edu.ph
Scientific Reports | (2021) 11:18345 | https://doi.org/10.1038/s41598-021-97869-1 1
Vol.:(0123456789)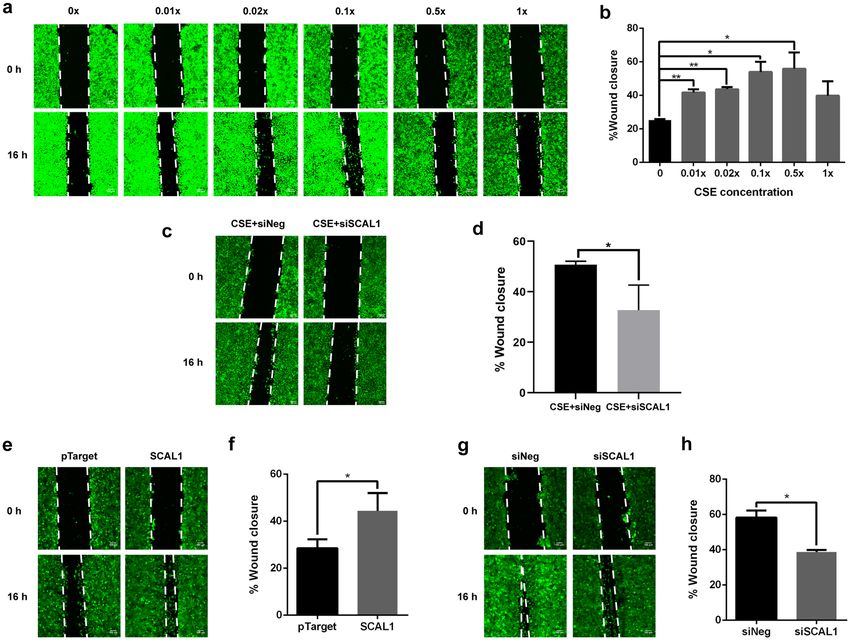
www.nature.com/scientificreports/
Figure 1. SCAL1 expression levels in CSE-treated A549 cells. (a) SCAL1 expression levels increased with
increasing concentrations of cigarette smoke extract (CSE), but decreased when cultured at the highest
concentration of CSE. (b) When cells were allowed to recover for 24 h in DMEM after 48 h of exposure to
0.1 × CSE, SCAL1 levels were significantly lower than if kept in 0.1 × CSE but still remained significantly higher
than in the control setup. Data presented are representative of three independent trials and are expressed as the
mean ± SD. *P < 0.05, **P < 0.01, ***P < 0.001 and ****P < 0.0001.
was later named smoke and cancer-associated lncRNA 1 (SCAL1) in airway epithelial cells of smokers, which
was also upregulated in lung cancer cells exposed to cigarette smoke13. Its discovery led to several hypotheses
that suggest SCAL1 may translate the chemical cues of smoke exposure into concrete oncogenic stimuli such as
epigenetic changes. The role of SCAL1 in oncogenesis now appears to be more universal and extends to other
cellular contexts. It has been shown to promote proliferation and invasion in clear cell renal cell carcinoma14,
hepatocellular carcinoma15, gastric c ancer16, cervical c ancer17, and glioma c ells18; proliferation, invasion, cell cycle
progression, and cell survival in papillary thyroid c ancer19; proliferation, cell survival, metastasis and inhibition
of tumor suppressor genes through DNA methylation in esophageal squamous cell c arcinoma20; proliferation
and induction of stem-like properties in breast cancer c ells21; proliferation and survival in ovarian c ancer22; and
inhibition of apoptosis in colorectal cancer cells23.
SCAL1 is an 890-bp lncRNA that has been posited to initiate repair in epithelial cells after smoke-induced
injury. In lung cancer cells, the expression of this lncRNA is necessary for combating DNA double-stranded
breaks induced by chemotherapeutic agents such as cisplatin and d oxorubicin24. SCAL1 expression is governed
by nuclear factor erythroid 2-related factor 2 (NRF2), a transcription factor considered the master regulator of
antioxidant genes, which normally protects cells from injury as a result of oxidative stress. Under physiological
conditions, NRF2 is ubiquitinated and degraded in the cytosol due to its interaction with Kelch-like ECH-
associated protein 1 (KEAP1). However, ROS generated upon electrophilic insult cause structural alterations in
the KEAP1 protein, which in turn allows NRF2 to escape degradation and translocate into the nucleus to activate
the expression of antioxidant genes. NRF2 can bind a putative nuclear factor-erythroid-2 (NFE2) binding site
in the SCAL1 promoter, thus upregulating its expression. Moreover, analysis of publicly available transcriptome
sequencing data of a large cohort of lung adenocarcinoma and squamous cell carcinoma revealed that SCAL1
expression correlated with KEAP1 and NFE2L2 (otherwise known as NRF2) mutational s tatus25.
Although postulated to rescue lung cancer cells from the toxic effects of cigarette smoke exposure as shown
in cell viability assays, the oncogenic effects of SCAL1 upregulation, either secondary to or decoupled from
cigarette smoke, have not been elucidated. In this study, the phenotypic consequences of exposure to cigarette
smoke extract (CSE) as well as SCAL1 overexpression and knockdown were investigated by studying their effects
on migratory capacity, formation of invasive structures secondary to extensive cytoskeletal reorganization, resist-
ance to apoptosis, and levels of reactive oxygen species (ROS).
Results
SCAL1 is upregulated in CSE‑treated A549 cells. A549 adenocarcinomic alveolar epithelial cells
were cultured in arbitrary dilutions of CSE-DMEM (0.01×, 0.02×, 0.1×, 0.5× CSE dilutions, and concentrated or
1× CSE) to facilitate dose-dependent studies on CSE-induced upregulation of SCAL1. In order to gauge SCAL1
lncRNA expression levels, total RNA was extracted from CSE-treated A549 cells after an incubation period
of 48 h. SCAL1 levels were then compared across setups exposed to varying CSE concentrations. As shown
in Fig. 1a, exposure to increasing CSE concentrations up to the twofold dilution setup was accompanied by a
corresponding increase in the relative expression levels of SCAL1. However, a reduction of SCAL1 levels was
observed in the concentrated CSE setup. SCAL1 expression levels were not significantly different from the levels
seen in the untreated setup.
To determine if reverting CSE-exposed cells to CSE-free medium will affect SCAL1 expression, two setups
of A549 cells were initially treated with 0.1× CSE. After 48 h, one setup was replenished with fresh 0.1× CSE
medium while the other was switched to CSE-free medium. RT-qPCR analysis showed that SCAL1 expression
Scientific Reports | (2021) 11:18345 | https://doi.org/10.1038/s41598-021-97869-1 2
Vol:.(1234567890)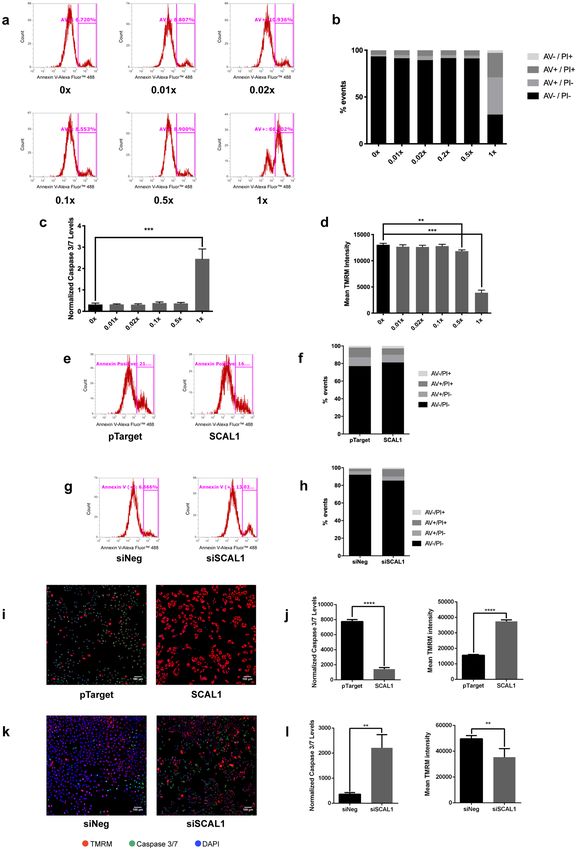
www.nature.com/scientificreports/

                                  Figure 2.  Scratch wound assay of CSE-treated A549 cells to measure migratory capacity. (a,b) Wound
                                  closure rates increased until the 0.5 × dilution setup but a sudden decrease was observed in the concentrated
                                  1 × setup. (c,d) When SCAL1 was knocked down 24 h post-exposure to 0.1 × CSE, wound closure after 16 h
                                  was significantly reduced compared to the control. (e,f) SCAL1 overexpression increased wound healing rates
                                  while the converse was observed upon (g,h) SCAL1 knockdown. Images shown are representative of three
                                  independent trials done in triplicates. Data presented are representative of three independent trials and are
                                  expressed as the mean ± SD. *P < 0.05, **P < 0.01, ***P < 0.001 and ****P < 0.0001.

                                  went down after switching CSE-exposed cells to CSE-free medium (Fig. 1b) indicating that acute exposure fol-
                                  lowed by a recovery period can downregulate SCAL1 expression.

                                  SCAL1 overexpression phenocopies effects of cigarette smoke exposure on migration rate of
                                  A549 cells. Effects of SCAL1 lncRNA on the migratory capacity of A549 lung cancer cells were investigated
                                  via the scratch wound assay. Migration of cells was measured in CSE-treated, SCAL1 overexpression, and SCAL1
                                  knockdown setups. Preliminary experiments showing overexpression and knockdown of SCAL1 in transfected
                                  cells are shown in Fig. S1.
                                      Migration rates of A549 cells exposed to different concentrations of CSE exhibited a similar trend as the
                                  RT-qPCR results of SCAL1 expression in Fig. 1a. Migration rates increased until the twofold dilution setup
                                  then decreased upon exposure to higher CSE levels (Fig. 2a,b). The increase in migratory capacity of A549 cells
                                  exposed to increasing concentrations of CSE, and the concomitant increase in the expression levels of SCAL1 sug-
                                  gest that the lncRNA may mediate the effects of cigarette smoke exposure, at least partially, in promoting cellular
                                  migration. To determine if indeed SCAL1 mediates the pro-migratory effect of CSE exposure, at least partially,
                                  A549 cells were treated with 0.1× CSE for 24 h to upregulate SCAL1 expression. The cells were then transfected
                                  with 30 nM siSCAL1 to knock down SCAL1 expression. Scratch wound assay confirmed that knockdown of
                                  SCAL1 in CSE-exposed cells significantly decreased migratory capacity of A549 cells (Fig. 2c,d).
                                      Overexpression of SCAL1 in A549 cells phenocopied the effects of CSE exposure, and increased migration
                                  rate compared to the pTargeT™ empty vector control (Fig. 2e,f). SCAL1 knockdown, on the other hand, decreased
                                  migratory capacity of A549 cells compared to the siNeg (negative control) setup (Fig. 2g,h). Taken together, these
                                  experiments done in CSE-free medium suggest that although SCAL1 upregulation may partially mediate the
                                  pro-migratory effect of CSE, its effect on cellular migration can still be decoupled from that of CSE.

Scientific Reports |   (2021) 11:18345 |               https://doi.org/10.1038/s41598-021-97869-1                                                  3

                                                                                                                                              Vol.:(0123456789)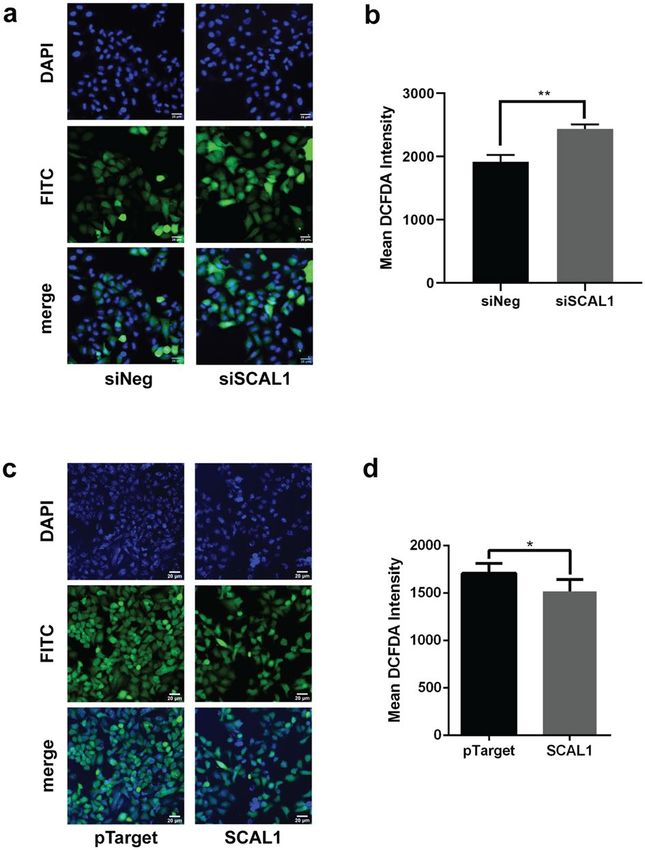
www.nature.com/scientificreports/
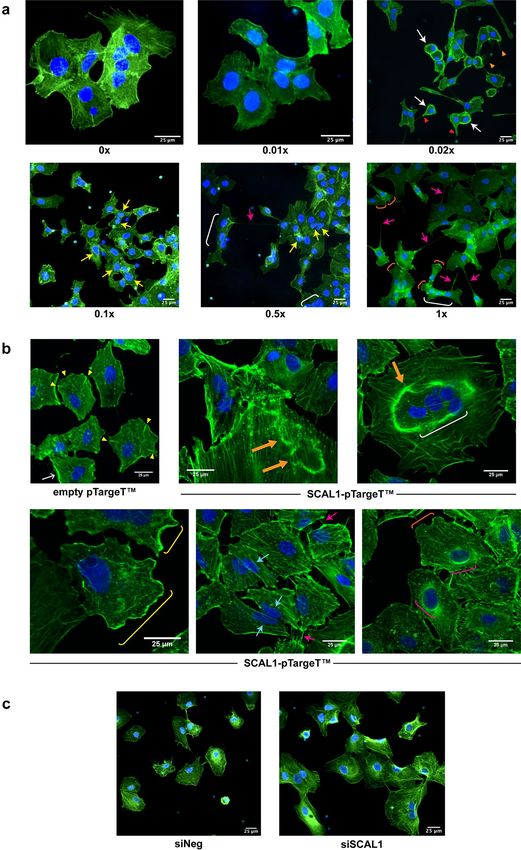
Distinct and overlapping effects of CSE treatment and SCAL1 upregulation on cytoskeletal
remodeling and formation of invasive structures. To investigate the effects of CSE exposure and
SCAL1 transcript levels on the invasive phenotype of A549 cells, the cytoskeletal architecture of treated or trans-
fected cells was evaluated by phalloidin staining and fluorescence microscopy. Analysis of the cytoskeletal organ-
ization of CSE-treated cells revealed variable gross morphological changes compared to untreated control A549
cells. As shown in Fig. 3a, at 0× and 0.01× CSE, A549 cells were relatively large with prominent focal adhesions
and stress fibers. Moreover, being an epithelial cell line, cell-to-cell adhesion facilitated by intercellular junctions
were prominent. At higher CSE concentrations, A549 cells were observed to decrease interactions with neigh-
boring cells. In 0.02× CSE, cytoskeletal reorganization was apparent with many cells assuming a round morphol-
ogy with thick peripheral actin rim and nuclei against one side of the cell. Peripheral actin bundles are a positive
indicator for lamellipodial formation and motility, and may also play a role in nuclear deformability during
migration26–28. Filopodia, thin cellular protrusions implicated in metastatic spread, are identifiable in control
untreated cells but more abundant in cells exposed to 0.02× CSE. Protrusive actin structures are also prominent.
In 0.1× and 0.5× CSE, there is a preponderance of misshapen or multilobulated nuclei as well as those exhibiting
blebs. Fused multinucleated cells are also more observable. Finally, cells exposed to higher concentrations of CSE
(0.5× and 1×) developed more intercellular connections that resemble tunneling nanotubes (TNTs). TNTs are
thin, actin-based intercellular bridges that allow the passage of organelles, plasma membrane components, and
cytoplasmic molecules between connected cells and may further promote invasiveness29–31. Detached cells with
cone-shaped migrating front and prominent lamellipodia, as well as multinucleated cells, can also be observed.
Overexpression of SCAL1 induced cytoskeletal changes that only partially overlap with those observed in
CSE-treated A549 cells (Fig. 3b). Control cells transfected with pTargeT empty vector only were generally polygo-
nal in shape with identifiable radial protrusions that represent stable focal adhesions which are able to prevent
migration. Cells transfected with SCAL1 show more transient structures that can disrupt stress fibers, and pro-
mote or facilitate cellular migration. These include peripheral ruffles, circular dorsal ruffles (CDRs), perinucelar
actin rims, and peripherally located stretched nuclei. Large multinucleated cells are also more observable.
In contrast, reduction of SCAL1 levels through RNA interference, led to relative stabilization of cytoskeletal
architecture. As shown in Fig. 3c, cells transfected with SCAL1-specific siRNA exhibited a more organized actin
cortex with parallel stress fibers and very few, shorter filopodia. Further, cells appear to be more adhered to each
other. The nuclei are also more regular in shape. The siNEG control, on the other hand, showed loosely packed
and criss-crossing actin filaments as well as more extensive filopodial formation, and are more solitary.
Overall, the distinct and overlapping effects of CSE treatment and SCAL1 upregulation on cytoskeletal reor-
ganization suggest that although SCAL1 upregulation may partially mediate the effects of CSE, its effects on
oncogenic phenotypes can still be decoupled from that of CSE.
Cigarette smoke and SCAL1 promote resistance to apoptosis in A549 cells. Resistance to apop-
tosis was assessed using Annexin V/Propidium Iodide (AV/PI) flow cytometry analysis. Treatment of A549
cells with CSE concentrations of 0 up to 0.5× followed by induction of apoptosis via the addition of menadione
sodium bisulfite (MSB) did not result in apoptosis as signified by the high fraction of AV−/PI− and low number
of AV+ cells in the population (Fig. 4a,b), suggesting that smoke exposure exhibited minimal to no toxicity.
However, in the concentrated CSE setup, a significant shift in the population was observed, with 31.27% AV−/
PI− cells, and 66.80% AV+ cells (Fig. 4a,b).
The high number of apoptotic cells may be attributed to an observed increase in caspase 3/7 (Fig. 4c) activa-
tion coupled with decreased mitochondrial function (Fig. 4d) in cells exposed to the highest CSE concentration.
In CSE-treated A549 in which SCAL1 is overexpressed, cells generally exhibited resistance to apoptotic induction
by maintaining low caspase 3/7 activity and preserving mitochondrial integrity (Fig. 4c,d). It is therefore possible
that CSE-induced SCAL1 upregulation confers resistance to apoptosis even in the presence of strong inducers.
To further explore the putative anti-apoptotic role of SCAL1 upregulation, SCAL1 overexpression and
knockdown were performed in the context of the apoptosis assays used with the various CSE concentrations.
Overexpressing SCAL1 in A549 reduced the percentage of AV+ cells from 21.52 to 16.75% (Fig. 4e,f) while
SCAL1 knockdown increased these apoptotic cells more than twofold from 6.09 to 13.57% (Fig. 4g,h). This is
consistent with the observed decreased caspase 3/7 activity and more intact mitochondria in A549 cells upon
overexpression of SCAL1 (Fig. 4i,j). Conversely, SCAL1 knockdown resulted in higher caspase 3/7 levels and
lower mitochondrial integrity (Fig. 4k,l).
SCAL1 detoxifies cells of ROS species. To determine if SCAL1 plays a role in detoxifying cells and
reducing ROS species, A549 cells were treated with 0.1× CSE for 24 h to upregulate SCAL1 expression. Cells
were then transfected with 30 nM siSCAL1 (Fig. 5a,b) to see if reduced levels of the lncRNA make cells more sus-
ceptible to oxidative stress. Intracellular ROS levels were assessed with the cell-permeant DCFDA (2′,7′-dichlor-
ofluorescin diacetate) fluorogenic dye. DCFDA staining of CSE-treated A549 cells revealed an increase in ROS
levels upon SCAL1 knockdown, suggesting that cells become more susceptible to oxidative stress when SCAL1
is downregulated.
In contrast, A549 cells transfected with pTargeT-SCAL1 construct yielded lower DCFDA fluorescence levels
compared to the vector only control (Fig. 5c,d). This suggests that SCAL1 upregulation consequently leads to
reduced intracellular ROS production, and thus the detoxification of A549 lung cancer cells.
These results also lend credence to the posited role of NRF2-mediated upregulation of antioxidant genes such
as SCAL1 secondary to cigarette smoke exposure, which protects cells from injury brought about by oxidative
stress.
Scientific Reports | (2021) 11:18345 | https://doi.org/10.1038/s41598-021-97869-1 4
Vol:.(1234567890)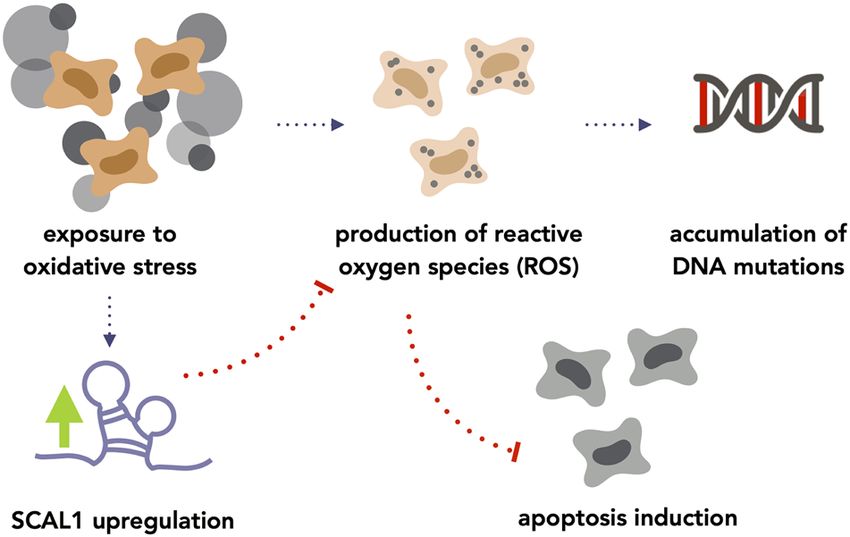
www.nature.com/scientificreports/

                                  Figure 3.  Fluorescent staining of CSE-treated, SCAL1-overexpressing and SCAL1-deficient A549 cells with Phalloidin-FITC and
                                  Hoechst 33342 (Olympus IX3-HOS, ×400, FITC: 500 ms). (a) A549 cells exposed to different CSE dilutions showed formation of
                                  structures associated with migration and invasion such as invadopodia (red arrowheads), hair-like filopodia (orange arrowheads),
                                  thick peripheral actin (white arrows), tunneling nanotube (TNT)-like structures (fuchsia arrows), multilobulated nuclei (yellow
                                  arrows), multinucleated cells (white brackets), and lamellipodia (orange brackets). (b) Empty vector-transfected control cells showed
                                  a stable cytoskeleton with prominent radial protrusions/focal adhesions (yellow arrowheads). Cells transfected with SCAL1 displayed
                                  transient structures such as circular dorsal ruffles (thick yellow orange arrows), peripheral dorsal ruffles (yellow brackets), stretched
                                  nuclei (cyan arrows) and perinuclear actin rims (fuchsia brackets). (c) A549 cells transfected with SCAL1-siRNA were more detached
                                  from one another and exhibited a more organized cytoskeleton with prominent stress fibers compared to siNeg controls.

Scientific Reports |   (2021) 11:18345 |                   https://doi.org/10.1038/s41598-021-97869-1                                                                         5

                                                                                                                                                                    Vol.:(0123456789)
www.nature.com/scientificreports/
Scientific Reports | (2021) 11:18345 | https://doi.org/10.1038/s41598-021-97869-1 6
Vol:.(1234567890)www.nature.com/scientificreports/
◂Figure 4. CSE treatment and SCAL1 expression enables A549 cells to resist apoptotic induction with MSB.
(a) Annexin V-Alexa Fluor 488-gated events representing apoptotic cells were unaffected by CSE treatment,
except for cells treated with 1× CSE. (b) Live cell populations (AV−/PI−) remained unchanged across
different CSE treatments, except for the 1× CSE setup exhibiting a shift to more apoptotic (AV+) cells. (c) Low
caspase 3/7 levels persisted in different CSE treatments but increased in the 1× CSE setup. (d) Mitochondrial
integrity measured with TMRM intensity was unaffected by incubation with lower levels CSE but was greatly
reduced in cells treated with 1× CSE. (e) Annexin V-Alexa Fluor 488-gated events were reduced upon SCAL1
overexpression. (f) Live cell population (AV−/PI−) increase was accompanied by a decrease of apoptotic cell
(AV+) number upon SCAL1 upregulation. (g) Annexin V-Alexa Fluor 488-gated events increased upon SCAL1
knockdown. (h) SCAL1 knockdown resulted in a reduced live cell population (AV−/PI−) and a greater number
of apoptotic (AV+) cells. (i,j) Fluorescent staining of caspase 3/7 and active mitochondria showed lower caspase
3/7 levels and a higher TMRM intensity in SCAL1-overexpressing cells. (k,l) SCAL1 knockdown resulted
in higher caspase 3/7 staining intensity and lower TMRM levels. Data presented are representative of three
independent trials performed in triplicates and are expressed as the mean ± SD. *P < 0.05, **P < 0.01, ***P < 0.001
and ****P < 0.0001.
Discussion
It is generally acknowledged that the acquisition of genetic lesions and formation of DNA adducts, in part due to
oxidative damage, drive cigarette smoke-associated lung oncogenesis32–34. The mechanisms by which cells survive
and remain viable despite these incessant genetic insults, however, remain unclear. The elucidation of the role
of NRF2 and how it activates antioxidant g enes35, 36 as a pro-survival mechanism shed some light on how cells
remain viable, albeit not without damage of functional consequence. More recently, lncRNAs were proposed to
play a role in detoxification processes as a response to xenobiotic insults.
Upon analysis of global RNA expression in smoke-exposed lung cancer cells, Thai et al.13 discovered a novel
lncRNA transcript (smoke and cancer-associated lncRNA 1 or SCAL1) that exhibited abnormally high expres-
sion levels. They also showed significant elevation of SCAL1 levels in airway epithelia of smokers versus non-
smokers, up to 5.3-fold higher in one, and 3.9-fold higher in another study. The present study aimed to further
characterize SCAL1 in terms of the oncogenic phenotypes it controls beyond cell viability and proliferation,
using A549 adenocarcinomic alveolar epithelial cells as model system. As with other lncRNAs, it remains to be
seen whether the observations and results described herein can be extrapolated to other cellular contexts, even
within lung tissues, given the high context-specificity of lncRNA function.
CSE and its consequent upregulation of SCAL1 were shown to promote cellular migration. SCAL1 response
to CSE exhibited dose-dependence until a specific threshold, beyond which SCAL1 returned to baseline levels
(Fig. 1a), quite possibly through the activation of a negative feedback mechanism that effectively inhibited its
expression. This trend was also reflected in the migratory capacity of cells exposed to varying concentrations of
CSE as shown in Fig. 2a,b. Excessive detoxification may have reduced oxidative electrophilic binding of stress
molecules to KEAP1, resulting in its stabilization, and allowed it to bind NRF2 again and facilitate its proteo-
lytic degradation. This, in turn, may switch off nascent transcription of SCAL1 while older SCAL1 transcripts
become destabilized.
Enhancement of migratory capacity as well as the extensive cytoskeletal remodeling observed may help pro-
vide an explanation for the high metastatic rates in smoke-associated lung carcinoma, as cells become equipped
with molecular escape mechanisms that allow them to leave the primary tumor site to establish new tumor
colonies elsewhere. The effects of CSE treatment, SCAL1 overexpression, and SCAL1 knockdown on cytoskeletal
organization were examined to find a correlation with the observed increase in migratory capacity of A549 lung
cancer cells. Cancer cells gain motility and invasive properties by forming matrix-degrading structures such as
lamellipodia and filopodia. While lamellipodia are the primary structures for cell locomotion, filopodia occur
at high frequencies in cancer cells and are therefore highly correlated with increased invasive c apacity37, 38. The
detection of these actin-rich structures in cells exposed to CSE and upon SCAL1 upregulation, as well as their
absence in SCAL1-deficient cells suggest that this lncRNA enhances the migratory capacity of A549 cells.
Treatment with CSE and exogenous SCAL1 overexpression produced overlapping and distinct transient
structures associated with migration and invasive capacity, suggesting that in some instances, their effects can
be decoupled. Formation of tunneling nanotubes was more readily apparent and extensive in CSE-treated A549
lung cancer cells. These filamentous extensions are under active investigation due to their role in direct cell-to-cell
communication and transmission of cellular cargo implicated in tumor invasion and m etastasis39. Aside from
opening discrete communication pathways, TNTs allow for the formation of open-ended channels that mediate
membrane continuity to balance stress factors caused by pathological changes and fluctuating conditions such
as oxidative stress or nutrient shortage. Intercellular transfer via TNTs thereby gives way to the occurrence of
molecular pathways that significantly impact major physiological processes such as cell survival, redox or meta-
bolic homeostasis through ROS detoxification, and mitochondrial h eteroplasmy40, 41. The formation of TNT-like
structures in CSE-exposed cells may be an adaptation mechanism to cope with the oxidative stress caused by
smoking. Other transient structures observed in CSE-treated cells include thick peripheral actin rims which are
linked to cellular motility as well. They are commonly a positive indicator for the formation of lamellipodia. These
actin rims may also play a role in the deformability and malleability of the nucleus during cellular migration28.
SCAL1 overexpression in the absence of CSE exposure, on the other hand, revealed transient structures that
are also able to cause cytoskeletal disorganization to promote or facilitate cellular migration. Peripheral ruffles,
CDRs, perinuclear actin rims, as well as peripherally located and stretched nuclei were prominent. Large multinu-
cleated cells were also observed. Peripheral ruffles and lamellipodia are associated with mesenchymal migration
Scientific Reports | (2021) 11:18345 | https://doi.org/10.1038/s41598-021-97869-1 7
Vol.:(0123456789)www.nature.com/scientificreports/
Figure 5. DCFDA staining of CSE-treated, SCAL1-deficient and SCAL1-overexpressing A549 cells to assess
production of reactive oxygen species (Olympus IX51, ×100, FITC: 500 ms). (a,b) The fluorescein-based
dye DCFDA exhibits green fluorescence upon oxidation by ROS. The bright green signal observed in A549
cells signifies ROS production. DCFDA intensities normalized against cell count showed increased mean
ROS production upon SCAL1 knockdown. (c,d) DCFDA fluorescence signals were lower in the SCAL1
overexpression setup, suggesting that increased SCAL1 levels decrease ROS production. Data presented are
representative of three independent trials performed in triplicates and are expressed as the mean ± SD. *P < 0.05,
**P < 0.01, ***P < 0.001 and ****P < 0.0001.
of cancer cells and can initiate both adhesive interactions and extracellular matrix (ECM) remodeling42. Periph-
eral ruffles eventually become CDRs by collapsing inwards, and in so doing are able to disrupt and soften the
cytoskeleton, thus enabling m igration43. CDRs are also known to play a role in micropinocytosis which supports
tumor growth44. The presence of perinuclear actin rims, peripheral nuclear displacement, and nuclear stretch-
ing or deformability all support the cytoskeletal remodeling that needs to happen in preparation for migration
and invasion45. The transient assembly of a perinuclear actin rim, in particular, is supposed to protect genome
integrity until cellular homeostasis is reestablished46. The distinct phenotypic effects on cytoskeletal remodeling
caused by SCAL1, in the absence of CSE exposure, suggest that SCAL1 upregulation may only partially medi-
ate the oncogenic effects of CSE exposure. Both CSE treatment and SCAL1 overexpression are able to promote
migratory capacity.
In CSE concentrations known to upregulate SCAL1 expression, A549 cells were shown to be resistant to
apoptosis even in the presence of strong inducers. Overexpression of pTargeT-SCAL1 construct by itself pro-
duced similar effects. On the other hand, SCAL1 knockdown resulted in higher caspase 3/7 levels and lower
mitochondrial integrity. Taken together, these suggest that SCAL1 upregulation, secondary to cigarette smoke
exposure or via alternative mechanisms, does protect cells and promote survival.
Response to oxidative stress was also studied by observing intracellular levels of stress-induced molecules
such as ROS. Oxidative damage to DNA as a result of high intracellular ROS levels have been shown to promote
cancer-causing mutations47. However, tumor cells may also upregulate antioxidant proteins and their regulators
for detoxification in order to prevent induction of ROS-mediated apoptosis and ensure cell survival. This was
confirmed in the apoptosis assays whereby cigarette smoke-exposed cells that overexpressed SCAL1 showed
resistance to induced cell death.
Cigarette smoke exposure of airway epithelial cells has been shown to increase ROS levels48, 49. In this study,
knockdown and overexpression of SCAL1 were employed to provide proof to earlier suggestions that SCAL1
upregulation may promote detoxification of cells to ensure their viability and survival. Indeed, knockdown of
SCAL1 in A549 cells pre-treated with 0.1× CSE to induce SCAL1 upregulation resulted in a corresponding
increase in ROS levels. Conversely, overexpression of pTargeT-SCAL1 produced opposite effects. Altogether,
these suggest that an increase in SCAL1 expression may lead to a decrease in intracellular ROS and a consequent
Scientific Reports | (2021) 11:18345 | https://doi.org/10.1038/s41598-021-97869-1 8
Vol:.(1234567890)www.nature.com/scientificreports/
Figure 6. Postulated pathway of SCAL1 upregulation to account for ROS reduction upon CSE exposure.
SCAL1 may be upregulated in response to oxidative stress to inhibit ROS production, which may effectively
inhibit the induction of apoptosis.
inhibition of ROS-mediated apoptosis. However, this also implies that cells which have already accumulated pos-
sibly deleterious and oncogenic DNA mutations may be spared from programmed cell death and may thus be
allowed to further propagate. In this case, oxidative stress may force cells to adapt by overexpressing antioxidant
genes such as SCAL1 to resist cell death, a negative implication of which is that damaged and tumorigenic cells
are effectively protected and allowed to survive (Fig. 6).
It is firmly established that chronic and not acute cigarette smoke exposure induces carcinogenesis. How-
ever, in vitro experiments following acute exposure, such as those described in this study, are instructive in that
they show how cellular oncogenic phenotypes are promoted and may become irreversible when exposure to
cigarette smoke is sustained, and DNA and cellular damage are allowed to override repair mechanisms. The fact
that SCAL1 was discovered from analysis of dysregulated transcripts in lung cancer patients with a history of
smoking suggests that chronic exposure to cigarette smoke can sustain or stabilize SCAL1 expression in vivo.
The results described in this study suggest a protective role for SCAL1 in the context of cigarette smoking,
with the caveat that cells with damaged DNA are also allowed to survive and multiply. The oncogenic effects of
SCAL1 can also be decoupled from those of cigarette smoke, suggesting that this lncRNA may be upregulated via
other mechanisms to promote oncogenicity. Either way, its potential as a diagnostic and prognostic biomarker
is already being considered. Sun et al.50, in their study involving 68 patients, showed that there is a statistically
significant association between increased SCAL1 levels and larger tumor size as well as advanced tumor-node-
metastasis (TNM) stage. Further, they showed that increased SCAL1 expression is associated with poor prognosis
and decreased overall survival. Targeting SCAL1 may also be a viable therapeutic option. SCAL1 knockdown may
sensitize cancer cells to targeted therapies by allowing anti-proliferative, anti-migratory and cell death signals to
put the brakes on tumor growth, metastatic spread and resistance to apoptosis.
Materials and methods
Culture of A549 cells in maintenance media and CSE‑infused media. Adenocarcinomic alveolar
epithelial cells (A549; ATCC; Manassas, VA, USA) were cultured and maintained in T-25 culture flasks with
Dulbecco’s Modified Eagle Medium (DMEM; Gibco®, Thermo Fisher Scientific, Inc., Waltham, MA, USA) and
10% fetal bovine serum (FBS; Gibco®) [DMEM + 10%FBS] in controlled environmental conditions (37 °C, 5%
CO2). Modified culture media containing CSE was formulated by attaching a cigarette stick to the nozzle of a
50 ml sterile syringe containing 10 ml of DMEM + 10%FBS. After the cigarette stick was lit, mainstream smoke
was suctioned by repeated pushing and pulling of the plunger. Upon consuming the stick, the media within
the syringe was shaken vigorously for 20 s to ensure maximum dissolution of the smoke. This procedure was
repeated 5 times, after which the resulting medium was sterilized through a 0.22 µm Minisart® filter and was
designated as concentrated CSE-DMEM (1 cigarette stick: 10 ml DMEM + 10% FBS).
A549 cells were seeded on assay plates and incubated for approximately 24 h to allow attachment to the sub-
strate. Subsequently, the medium was replaced with CSE-DMEM of different dilutions [concentrated CSE (1×),
twofold dilution (0.5×), tenfold dilution (0.1×), 50-fold dilution (0.02×), and 100-fold dilution (0.01×)] while
one well was replenished with maintenance medium as a control. A549 cells were cultured for an additional 48 h
before performing downstream functional assays and analyses.
RNA extraction. The RNEasy Plus Mini Kit (Qiagen Sciences, Inc., Germantown, MD, USA) was used to
extract total RNA from A549 seeded at a density of 150,000 cells per well on a 12-well plate. RNA concentra-
tion was determined spectrophotometrically (λmax = 260 nm) using the Nanodrop 2000c spectrophotometer
(Thermo Fisher Scientific) and samples were stored at − 80 °C until further use.
Detection of SCAL1 expression levels via RT‑qPCR. RT-qPCR was performed using the PowerUp™
SYBR Green Real-Time PCR (Thermo Fisher Scientific) kit according to the manufacturer’s recommended pro-
tocol. Using 200 U of M-MLV reverse transcriptase ( Promega®, Madison, WI, USA), 2000 ng of RNA was reverse
Scientific Reports | (2021) 11:18345 | https://doi.org/10.1038/s41598-021-97869-1 9
Vol.:(0123456789)www.nature.com/scientificreports/
Designation Sequence (5′ to 3′)
Forward: CTGTCCCTCAGTGTTCTACTT C
SCAL1 (qPCR)
Reverse: CTGGCATCCATTGTGTCTTATTT
Forward: CCT AAA GCA TAC GGG TCC TGG CAT C
Cyclophilin
Reverse: GTG GAG GGG TGC TCT CCT GAG CTA C
Table 1. Primers used in reverse transcription-quantitative PCR (RT-qPCR).
transcribed into cDNA. An annealing reaction mixture containing oligo-dTs, random hexamers, and the RNA
sample was incubated at 70 °C for 5 min. The M-MLV reverse transcriptase buffer was then added to the mix-
ture to a final 1× concentration. In addition, 25 U of RNase inhibitor (Promega®), 0.075 mM of deoxynucleoside
triphosphate (dNTPs), and 200 U of M-MLV reverse transcriptase were included in the reaction mixture to a
final volume of 25 µl. The reverse transcription process was facilitated by an hour-long incubation at 37 °C and
the resulting cDNA was stored at − 20 °C until use.
SCAL1 transcript levels in A549 cells exposed to different titers of CSE-DMEM were compared. To ascertain
the effect of recovery after acute exposure to CSE on SCAL1 expression, A549 cells were treated with 0.1× CSE-
DMEM for 48 h and were then cultured in CSE-free DMEM for 24 h. Table 1 shows the primers used to amplify
the SCAL1 transcript and the cyclophilin gene as a normalization control.
Generation of SCAL1 lncRNA gene expression construct. SCAL1 gene blocks were obtained from
Integrated DNA Technologies (Coralville, IA, USA) (ref.no. 98409609). This transcript was cloned into the
pGEM®-T Easy cloning vector (Promega®) via non-directional TA-cloning. A-overhangs were added prior to liga-
tion as follows: a tube containing 1× Titanium Taq buffer, 5× Titanium Taq polymerase (Clontech Laboratories,
Inc., Mountain View, CA, USA), and 1 mM dNTPs was first incubated at 95 °C for 5 min, after which 24.5 ng of
the gene block was added and the resulting mixture was incubated at 72 °C for 15 min. From the solution with
poly A-appended SCAL1 blocks, 1.1 µl was added to a separate mixture of 2× T4 DNA ligase buffer ( Roche®
Diagnostic, GmbH, Mannheim, Germany), 50 ng of pGEM®-T Easy cloning vector (Promega®), and 0.25 U of T4
DNA ligase buffer (Roche®). The 5.2-µl solution was then incubated with the following profile: 4 °C for 2 h, 22 °C
for 4 h, and 14 °C overnight after which it was used for transformation into DH5α ultracompetent E. coli cells.
Recombinant pGEM®-T Easy-SCAL1 constructs with verified sequences were digested with EcoRI, subcloned
into the pTargeT™ mammalian expression vector, and verified by sequencing for accuracy and directionality.
Knockdown of SCAL1 in A549 cells. In a 12-well plate, approximately 300,000 A549 cells were seeded
per well and transfected with 30 nM of the AllStars (Qiagen Sciences, Inc., Germantown, MD, USA) negative
control siRNA (si-NEG, cat.no. 1027280) or 30 nM of SCAL1-siRNA (Hs_LOC100505994_3; Qiagen FlexiTube
siRNA SI05713505). The negative control used is a non-silencing control siRNA with no known homology to
any mammalian gene. Transfecting a universal siRNA control accounts for the stress of transfection and was
used as the basis for determining normal, basal levels of gene expression.
In all setups, A549 cells were transfected with the appropriate amounts of siRNA with Lipofectamine™ 3000
transfection reagent (Invitrogen). RNA-Lipofectamine™ complexes were prepared as follows: per transfection
reaction, the 30 nM of siRNA was diluted to a final volume of 50 µl with Opti-MEM. In another tube, 3 µl of the
Lipofectamine™ 3000 transfection reagent was diluted to 50 µl with Opti-MEM. The RNA and Lipofectamine™
solutions were then mixed and incubated at room temperature for 10–15 min to allow for complexation to occur,
after which the resulting 100 µl solution was added to adherent A549 cells. Forty-eight hours post-transfection,
the cells were harvested for subsequent molecular, morphological, and functional characterization experiments.
Efficiency of SCAL1 knockdown was assessed via RT-qPCR as previously described.
Transfection of pTargeT™‑SCAL1 construct into A549 cells. Twenty-four hours after seed-
ing 150,000 A549 cells into a 12-well plate, 1000 ng of the construct was transfected using the same method
employed for lipofection of SCAL1-siRNA in knockdown studies. In separate wells, 1000 ng of empty pTargeT™
vector and empty pmR-ZsGreen1 vector were transfected as negative control and transfection efficiency tracker,
respectively.
For each setup, cell count was determined using the Bio-Rad TC20™ Automated Cell Counter (Bio-Rad Labo-
ratories, Inc., Hercules, CA, USA) from which the appropriate number of cells to seed per assay was calculated.
All assays (minimum of three trials) were performed with samples seeded in triplicates to ensure repeatability
of obtained results.
Scratch wound assay. In the scratch wound assay, approximately 20,000 A549 cells were seeded per well
in a 96-well clear-bottom black plate (Corning) with DMEM + 10%FBS maintenance medium. Cells were incu-
bated at 37 °C with 5% C O2, to allow cells to attach. In order to facilitate quantification of wound closure rate,
cells were stained with the fluorescent dye calcein. Briefly, Calcein AM was added to each well at a final concen-
tration of 2 µg/ml in low serum medium (DMEM + 2%FBS). A sterile toothpick was then used to scratch the
well in a straight line to create a wound in the confluent cell monolayer. Wells were washed with 1× D-PBS and
subsequently imaged using the GE IN Cell Analyzer 6000 high-content imaging system (GE Healthcare Life Sci-
Scientific Reports | (2021) 11:18345 | https://doi.org/10.1038/s41598-021-97869-1 10
Vol:.(1234567890)www.nature.com/scientificreports/
ences; Marlborough, Massachusetts, USA). Cells were again stained for calcein after 16 h and imaged afterwards.
Wound closure rates were measured with GE IN Cell Analyzer 6000 Analysis Software.
Monitoring changes in cytoskeletal architecture. Analysis of cellular morphology was facilitated by
staining actin filaments with fluorescein isothiocyanate (FITC) conjugated phalloidin (5 µg/ml; Life Technolo-
gies, Thermo Fisher Scientific, Inc., Waltham, MA, USA) and nuclei with Hoechst 33342 (5 µg/ml; Life Tech-
nologies). A549 cells seeded on a 96-well clear-bottom black plate (Corning) (5000 cells). Twenty-four hours
after seeding, cells were either treated with CSE or transfected with the siRNA or the overexpression plasmid.
After 48 h, culture media was removed, and wells were washed with 1× PBS before adding 4% paraformaldehyde
for sample fixation at room temperature for 1 h. Cells were then washed with ice-cold PBS three times for 5 min
each, after which 0.1% Triton™ X-100 (Sigma-Aldrich, St. Louis, MO, USA) was added to permeabilize the cells
at room temperature for 10 min. This was followed by a blocking step which involved the addition of 1% BSA
and incubation at room temperature for 1 h with constant agitation (60 rpm). After washing cells with ice-cold
1× PBS, FITC-conjugated phalloidin was added and samples were incubated with the fluorescent cytoskeletal
stain for 30 min with constant agitation (60 rpm) at room temperature in the dark. Cells were again washed
with ice-cold 1× PBS, followed by the addition of the nuclear stain Hoechst 33342 and subsequent incubation
for 15 min at room temperature in the dark. After a final wash step with ice-cold 1× PBS, fluorescent images
were obtained with the GE IN Cell Analyzer 6000 high-content imager and the Olympus IX3-HOS microscope
(Olympus Corp., Tokyo, Japan) using the green fluorescent filter (λex/λem:490/525 nm) to visualize stained fila-
mentous actin structures, and the blue fluorescent filter (λex/λem:355/465 nm) to visualize the nuclei.
Staining of reactive oxygen species with DCFDA. Visualization and measurement of intracellular lev-
els of reactive oxygen species (ROS) was performed by staining with 2′,7′-dichlorofluorescein diacetate (DCFDA;
Sigma-Aldrich, St. Louis, MO, USA). Reseeding for DCFDA staining was done by placing 8000 A549 cells per
well on a 96-well clear-bottom black plate (Corning). For SCAL1 knockdown, cells were treated with 0.1× CSE
for 24 h to induce SCAL1 upregulation and was subsequently transfected with 30 nM siSCAL1 to reduce intra-
cellular SCAL1. For SCAL1 overexpression, cells were transfected with pTargeT-SCAL1 and incubated for 24 h
before treating with 0.1× CSE. Forty-eight hours post-transfection of either siSCAL1 or pTarget-SCAL1, the
DCFDA stain (50 µM) was added to each well. The assay plate was incubated at 37 °C for 20 min before observa-
tion and imaging with the GE IN Cell Analyzer 6000 high-content imager at λex/λem:485/535 nm.
Annexin V/propidium iodide flow cytometry analysis. In a Corning flat-bottom polystyrene 12-well
plate, 150,000 cells were seeded and allowed to attach. Apoptosis was induced by incubation with 100 µM mena-
dione sodium bisulfite (Sigma-Aldrich) in reduced serum medium (DMEM + 4%FBS) for 12 h. All suspended
and adherent cells were collected, after which apoptotic cells were observed using the Alexa Fluor 488 Annexin
V/Dead Cell Apoptosis Kit (Thermo Fisher Scientific) according to the manufacturer’s instructions.
Measurement of Caspase 3/7 levels and mitochondrial integrity. A549 cells were seeded in
a Corning flat-bottom polystyrene 96-well plate (5000 cells). Subsequently, 24 h after seeding, apoptosis was
induced by incubation with 100 µM menadione sodium bisulfite (Sigma-Aldrich) in reduced serum medium
(DMEM + 4%FBS) for 12 h. Caspase 3/7 activity and mitochondrial activity were detected by incubation with
2 µM of CellEvent™ Caspase-3/7 Green Detection Reagent (Thermo Fisher Scientific) and 2 µM of Image-iT™
TMRM Reagent (Thermo Fisher Scientific) for 30 min. Fluorescent images were obtained with the GE IN Cell
Analyzer 6000 high-content imager (Caspase-3/7 λex/λem:503/530 nm; TMRM λex/λem:548/574 nm). Quanti-
fication of fluorescent signals was performed using the IN Cell Developer Toolbox v1.6 (GE Healthcare).
Statistical analysis. To quantify the differences between the control and various experimental setups, the
unpaired two-tailed Student’s t test was used. The quantifications in the various figures are presented as the
mean ± standard deviation (SD). P < 0.05 was used to define statistical significance.
Ethical approval. This article does not contain any studies with human participants or animals performed
by any of the authors.
Data availability
Data generated in this study are available from the corresponding author on reasonable request.
Received: 27 February 2021; Accepted: 31 August 2021
References
1. Karlsson, A. et al. Genomic and transcriptional alterations in lung adenocarcinoma in relation to smoking history. Clin. Cancer
Res. 20, 4912–4924 (2014).
2. Islami, F., Torre, L. A. & Jemal, A. Global trends of lung cancer mortality and smoking prevalence. Transl. Lung Cancer Res. 4,
327–338 (2015).
3. Hecht, S. S. Cigarette smoking and lung cancer: Chemical mechanisms and approaches to prevention. Lancet Oncol. 3, 461–469
(2002).
4. Luo, J. et al. Long non-coding RNA CARLo-5 is a negative prognostic factor and exhibits tumor pro-oncogenic activity in non-
small cell lung cancer. Tumor Biol. 35, 11541–11549 (2014).
Scientific Reports | (2021) 11:18345 | https://doi.org/10.1038/s41598-021-97869-1 11
Vol.:(0123456789)www.nature.com/scientificreports/
5. Guo, L. et al. Long non-coding RNA DANCR promotes the progression of non-small-cell lung cancer by inhibiting p21 expression.
OTT 12, 135–146 (2018).
6. Jin, S.-J., Jin, M.-Z., Xia, B.-R. & Jin, W.-L. Long non-coding RNA DANCR as an emerging therapeutic target in human cancers.
Front. Oncol. 9, 1225 (2019).
7. Nie, F. et al. Long noncoding RNA ANRIL promotes non-small cell lung cancer cell proliferation and inhibits apoptosis by silencing
KLF2 and P21 expression. Mol. Cancer Ther. 14, 268–277 (2015).
8. Gao, L. et al. Long non-coding RNA H19 is responsible for the progression of lung adenocarcinoma by mediating methylation-
dependent repression of CDH1 promoter. J. Cell Mol. Med. 23, 6411–6428 (2019).
9. Qiu, M. et al. CCAT2 is a lung adenocarcinoma-specific long non-coding RNA and promotes invasion of non-small cell lung
cancer. Tumor Biol. 35, 5375–5380 (2014).
10. Sun, M. et al. Downregulation of BRAF activated non-coding RNA is associated with poor prognosis for non-small cell lung cancer
and promotes metastasis by affecting epithelial-mesenchymal transition. Mol. Cancer 13, 68 (2014).
11. Lu, K. et al. Long non-coding RNA MEG3 inhibits NSCLC cells proliferation and induces apoptosis by affecting p53 expression.
BMC Cancer 13, 461 (2013).
12. Zhang, E. et al. P53-regulated long non-coding RNA TUG1 affects cell proliferation in human non-small cell lung cancer, partly
through epigenetically regulating HOXB7 expression. Cell Death Dis. 5, e1243–e1243 (2014).
13. Thai, P. et al. Characterization of a novel long noncoding RNA, SCAL1, induced by cigarette smoke and elevated in lung cancer
cell lines. Am. J. Respir. Cell Mol. Biol. 49, 204–211 (2013).
14. Zheng, Z. et al. Long non-coding RNA LUCAT1 promotes proliferation and invasion in clear cell renal cell carcinoma through
AKT/GSK-3β signaling pathway. Cell Physiol. Biochem. 48, 891–904 (2018).
15. Lou, Y. et al. Long non-coding RNA LUCAT1 promotes tumourigenesis by inhibiting ANXA2 phosphorylation in hepatocellular
carcinoma. J. Cell Mol. Med. 23, 1873–1884 (2019).
16. Chi, J. et al. Long non-coding RNA LUCAT1 promotes proliferation and invasion in gastric cancer by regulating miR-134–5p/
YWHAZ axis. Biomed. Pharmacother. 118, 109201 (2019).
17. Zhang, L., Liu, S.-K., Song, L. & Yao, H.-R. SP1-induced up-regulation of lncRNA LUCAT1 promotes proliferation, migration and
invasion of cervical cancer by sponging miR-181a. Artif. Cells Nanomed. Biotechnol. 47, 555–563 (2019).
18. Gao, Y.-S., Liu, X.-Z., Zhang, Y.-G., Liu, X.-J. & Li, L.-Z. Knockdown of long noncoding RNA LUCAT1 inhibits cell viability and
invasion by regulating miR-375 in glioma. Oncol. Res. 26, 307–313 (2018).
19. Luzón-Toro, B. et al. LncRNA LUCAT1 as a novel prognostic biomarker for patients with papillary thyroid cancer. Sci. Rep. 9,
14374 (2019).
20. Yoon, J.-H. et al. The long noncoding RNA LUCAT1 promotes tumorigenesis by controlling ubiquitination and stability of DNA
methyltransferase 1 in esophageal squamous cell carcinoma. Cancer Lett. 417, 47–57 (2018).
21. Zheng, A. et al. Long non-coding RNA LUCAT1/miR-5582-3p/TCF7L2 axis regulates breast cancer stemness via Wnt/β-catenin
pathway. J. Exp. Clin. Cancer Res. 38, 305 (2019).
22. Liu, H.-Z. et al. LncRNA LUCAT1 promotes proliferation of ovarian cancer cells by regulating miR-199a-5p expression. Eur. Rev.
Med. Pharmacol. Sci. 24, 1682–1687 (2020).
23. Huan, L. et al. Hypoxia induced LUCAT1/PTBP1 axis modulates cancer cell viability and chemotherapy response. Mol. Cancer
19, 11 (2020).
24. Statt, S. et al. Abstract 1469: Functional roles of SCAL1 expression in lung cancer and progression. In Molecular and Cellular Biol-
ogy 1469–1469 (American Association for Cancer Research, 2014). https://doi.org/10.1158/1538-7445.AM2014-1469.
25. White, N. M. et al. Transcriptome sequencing reveals altered long intergenic non-coding RNAs in lung cancer. Genome Biol. 15,
429 (2014).
26. Arjonen, A., Kaukonen, R. & Ivaska, J. Filopodia and adhesion in cancer cell motility. Cell Adh. Migr. 5, 421–430 (2011).
27. Machesky, L. M. Lamellipodia and filopodia in metastasis and invasion. FEBS Lett. 582, 2102–2111 (2008).
28. Yamaguchi, H. & Condeelis, J. Regulation of the actin cytoskeleton in cancer cell migration and invasion. Biochim. Biophys. Acta
Mol. Cell Res. 1773, 642–652 (2007).
29. Mittal, R. et al. Cell communication by tunneling nanotubes: Implications in disease and therapeutic applications. J. Cell. Physiol.
234, 1130–1146 (2019).
30. Panasiuk, M., Rychłowski, M., Derewońko, N. & Bieńkowska-Szewczyk, K. Tunneling nanotubes as a novel route of cell-to-cell
spread of herpesviruses. J. Virol. 92, 1–17 (2018).
31. Sahu, P., Jena, S. R. & Samanta, L. Tunneling nanotubes: A versatile target for cancer therapy. Curr. Cancer Drug Targets 18, 514–521
(2018).
32. Ceppi, M., Munnia, A., Cellai, F., Bruzzone, M. & Peluso, M. E. M. Linking the generation of DNA adducts to lung cancer. Toxicol-
ogy 390, 160–166 (2017).
33. Hecht, S. S. Lung carcinogenesis by tobacco smoke. Int. J. Cancer 131, 2724–2732 (2012).
34. Peluso, M. et al. DNA adducts and lung cancer risk: A prospective study. Can. Res. 65, 8042–8048 (2005).
35. Kansanen, E., Kuosmanen, S. M., Leinonen, H. & Levonen, A.-L. The Keap1-Nrf2 pathway: Mechanisms of activation and dys-
regulation in cancer. Redox Biol. 1, 45–49 (2013).
36. Niture, S. K., Khatri, R. & Jaiswal, A. K. Regulation of Nrf2—an update. Free Radical Biol. Med. 66, 36–44 (2014).
37. Coopman, P. J., Do, M. T., Thompson, E. W. & Mueller, S. C. Phagocytosis of cross-linked gelatin matrix by human breast carcinoma
cells correlates with their invasive capacity. Clin. Cancer Res. 4, 507–515 (1998).
38. Wang, W. et al. Single cell behavior in metastatic primary mammary tumors correlated with gene expression patterns revealed by
molecular profiling. Can. Res. 62, 6278–6288 (2002).
39. Lou, E. et al. Tunneling nanotubes. Commun. Integrat. Biol. 5, 399–403 (2012).
40. Marzo, L., Gousset, K. & Zurzolo, C. Multifaceted roles of tunneling nanotubes in intercellular communication. Front. Physiol. 3,
1–14 (2012).
41. Rustom, A. Nanotubular highways for intercellular organelle transport. Science 303, 1007–1010 (2004).
42. Friedl, P. & Wolf, K. Plasticity of cell migration: A multiscale tuning model. J. Cell Biol. 188, 11–19 (2010).
43. Krueger, E. W., Orth, J. D., Cao, H. & McNiven, M. A. A dynamin–cortactin–Arp2/3 complex mediates actin reorganization in
growth factor-stimulated cells. MBoC 14, 1085–1096 (2003).
44. Hoon, J.-L., Wong, W.-K. & Koh, C.-G. Functions and regulation of circular dorsal ruffles. Mol. Cell. Biol. 32, 4246–4257 (2012).
45. Madrazo, E., Conde, A. C. & Redondo-Muñoz, J. Inside the cell: Integrins as new governors of nuclear alterations?. Cancers 9, 82
(2017).
46. Shao, X., Li, Q., Mogilner, A., Bershadsky, A. D. & Shivashankar, G. V. Mechanical stimulation induces formin-dependent assembly
of a perinuclear actin rim. Proc. Natl. Acad. Sci. USA 112, E2595–E2601 (2015).
47. Schumacker, P. Reactive oxygen species in cancer: A dance with the devil. Cancer Cell 27, 156–157 (2015).
48. Chen, Z. et al. Oxidative DNA damage is involved in cigarette smoke-induced lung injury in rats. Environ. Health Prev. Med. 20,
318–324 (2015).
49. Goldkorn, T., Filosto, S. & Chung, S. Lung injury and lung cancer caused by cigarette smoke-induced oxidative stress: Molecular
mechanisms and therapeutic opportunities involving the ceramide-generating machinery and epidermal growth factor receptor.
Antioxid. Redox Signal. 21, 2149–2174 (2014).
Scientific Reports | (2021) 11:18345 | https://doi.org/10.1038/s41598-021-97869-1 12
Vol:.(1234567890)www.nature.com/scientificreports/
50. Sun, Y. et al. Long non-coding RNA LUCAT1 is associated with poor prognosis in human non-small cell lung cancer and regulates
cell proliferation via epigenetically repressing p21 and p57 expression. Oncotarget 8, 28297–28311 (2017).
Acknowledgements
This work was supported by in-house grants from the National Institute of Molecular Biology and Biotechnology,
University of the Philippines Diliman.
Author contributions
R.L.G. conceptualized the study and provided overall supervision and resources. C.R.V.C. and J.L.M.F. did the
experiments, data curation and processing, and preparation of figures. C.R.V.C. and R.L.G. wrote the manu-
script. R.L.G. did the final editing and revisions. All authors have reviewed and agreed to the final version of
the manuscript.
Competing interests
The authors declare no competing interests.
Additional information
Supplementary Information The online version contains supplementary material available at https://doi.org/
10.1038/s41598-021-97869-1.
Correspondence and requests for materials should be addressed to R.L.G.
Reprints and permissions information is available at www.nature.com/reprints.
Publisher’s note Springer Nature remains neutral with regard to jurisdictional claims in published maps and
institutional affiliations.
Open Access This article is licensed under a Creative Commons Attribution 4.0 International
License, which permits use, sharing, adaptation, distribution and reproduction in any medium or
format, as long as you give appropriate credit to the original author(s) and the source, provide a link to the
Creative Commons licence, and indicate if changes were made. The images or other third party material in this
article are included in the article’s Creative Commons licence, unless indicated otherwise in a credit line to the
material. If material is not included in the article’s Creative Commons licence and your intended use is not
permitted by statutory regulation or exceeds the permitted use, you will need to obtain permission directly from
the copyright holder. To view a copy of this licence, visit http://creativecommons.org/licenses/by/4.0/.
© The Author(s) 2021
Scientific Reports | (2021) 11:18345 | https://doi.org/10.1038/s41598-021-97869-1 13
Vol.:(0123456789)You can also read