Contribution of the world's main dust source regions to the global cycle of desert dust
←
→
Page content transcription
If your browser does not render page correctly, please read the page content below
Atmos. Chem. Phys., 21, 8169–8193, 2021
https://doi.org/10.5194/acp-21-8169-2021
© Author(s) 2021. This work is distributed under
the Creative Commons Attribution 4.0 License.

Contribution of the world’s main dust source regions
to the global cycle of desert dust
Jasper F. Kok1 , Adeyemi A. Adebiyi1 , Samuel Albani2,3 , Yves Balkanski3 , Ramiro Checa-Garcia3 , Mian Chin4 ,
Peter R. Colarco4 , Douglas S. Hamilton5 , Yue Huang1 , Akinori Ito6 , Martina Klose7,a , Longlei Li5 ,
Natalie M. Mahowald5 , Ron L. Miller8 , Vincenzo Obiso7,8 , Carlos Pérez García-Pando7,9 , Adriana Rocha-Lima10,11 ,
and Jessica S. Wan5,b
1 Department  of Atmospheric and Oceanic Sciences, University of California, Los Angeles, CA 90095, USA
2 Department  of Environmental and Earth Sciences, University of Milano-Bicocca, Milan, Italy
3 Laboratoire des Sciences du Climat et de l’Environnement, CEA-CNRS-UVSQ-UPSaclay, Gif-sur-Yvette, France
4 Atmospheric Chemistry and Dynamics Laboratory, NASA Goddard Space Flight Center, Greenbelt, MD 20771, USA
5 Department of Earth and Atmospheric Sciences, Cornell University, Ithaca, NY 14850, USA
6 Yokohama Institute for Earth Sciences, JAMSTEC, Yokohama, Kanagawa 236-0001, Japan
7 Barcelona Supercomputing Center (BSC), 08034 Barcelona, Spain
8 NASA Goddard Institute for Space Studies, New York, NY 10025, USA
9 ICREA, Catalan Institution for Research and Advanced Studies, 08010 Barcelona, Spain
10 Physics Department, UMBC, Baltimore, Maryland, USA
11 Joint Center Joint Center for Earth Systems Technology, UMBC, Baltimore, Maryland, USA
a present address: Institute of Meteorology and Climate Research (IMK-TRO), Department Troposphere Research,

Karlsruhe Institute of Technology (KIT), Karlsruhe, Germany
b present address: Scripps Institution of Oceanography, University of California San Diego, La Jolla, CA 92093, USA

Correspondence: Jasper F. Kok (jfkok@ucla.edu)

Received: 5 January 2021 – Discussion started: 18 January 2021
Revised: 20 April 2021 – Accepted: 23 April 2021 – Published: 27 May 2021

Abstract. Even though desert dust is the most abundant              loading of dust with a geometric diameter up to 20 µm is par-
aerosol by mass in Earth’s atmosphere, the relative contri-         titioned as follows: North African source regions contribute
butions of the world’s major source regions to the global           ∼ 50 % (11–15 Tg), Asian source regions contribute ∼ 40 %
dust cycle remain poorly constrained. This problem hinders          (8–13 Tg), and North American and Southern Hemisphere
accounting for the potentially large impact of regional dif-        regions contribute ∼ 10 % (1.8–3.2 Tg). These results sug-
ferences in dust properties on clouds, the Earth’s energy           gest that current models on average overestimate the contri-
balance, and terrestrial and marine biogeochemical cycles.          bution of North African sources to atmospheric dust loading
Here, we constrain the contribution of each of the world’s          at ∼ 65 %, while underestimating the contribution of Asian
main dust source regions to the global dust cycle. We use an        dust at ∼ 30 %. Our results further show that each source re-
analytical framework that integrates an ensemble of global          gion’s dust loading peaks in local spring and summer, which
aerosol model simulations with observationally informed             is partially driven by increased dust lifetime in those sea-
constraints on the dust size distribution, extinction efficiency,   sons. We also quantify the dust deposition flux to the Ama-
and regional dust aerosol optical depth (DAOD). We ob-              zon rainforest to be ∼ 10 Tg yr−1 , which is a factor of 2–3
tain a dataset that constrains the relative contribution of nine    less than inferred from satellite data by previous work that
major source regions to size-resolved dust emission, atmo-          likely overestimated dust deposition by underestimating the
spheric loading, DAOD, concentration, and deposition flux.          dust mass extinction efficiency. The data obtained in this pa-
We find that the 22–29 Tg (1 standard error range) global           per can be used to obtain improved constraints on dust im-

Published by Copernicus Publications on behalf of the European Geosciences Union.

8170                                                   J. F. Kok et al.: Contribution of the world’s main dust source regions

pacts on clouds, climate, biogeochemical cycles, and other         dust has potentially doubled since pre-industrial times (Ma-
parts of the Earth system.                                         howald et al., 2010; Hooper and Marx, 2018), some of these
                                                                   effects might have produced a marine biogeochemical re-
                                                                   sponse (Hamilton et al., 2020; Ito et al., 2020) that might
                                                                   have resulted in a substantial global indirect radiative forc-
1   Introduction                                                   ing (Mahowald, 2011). As such, constraining source-specific
                                                                   dust emissions and loading is critical to constraining global
Desert dust is likely the most abundant aerosol type by mass       climate sensitivity (Andreae et al., 2005; Kiehl, 2007).
(Kinne et al., 2006; Kok et al., 2017) and produces a range of        Many past studies of the contributions of the main dust
important impacts on the Earth system, including on clouds,        source regions to the global dust cycle have been based on
the Earth’s energy and water budgets, and biogeochemical           global aerosol model simulations (Tanaka and Chiba, 2006;
cycles (Shao et al., 2011; Mahowald et al., 2014; Miller et al.,   Chin et al., 2007; Huneeus et al., 2011; Wu et al., 2020).
2014). These impacts are spatially heterogeneous, not only         These simulations exhibit substantial biases when compared
because dust loading itself varies substantially between re-       to observations of dust abundance and of dust microphysi-
gions, but also because the properties of dust depend on min-      cal properties like size distribution and mass extinction ef-
eralogy, which varies with the region of origin (Claquin et        ficiency (Kok et al., 2014a; Ansmann et al., 2017; Adebiyi
al., 1999; Grousset and Biscaye, 2005; Journet et al., 2014).      et al., 2020; Checa-Garcia et al., 2020). Recognizing this
Consequently, determining dust impacts on the Earth system         problem, Ginoux et al. (2012) made an important advance
requires not only constraints on global dust loading (Huneeus      towards more accurate constraints on the regional contribu-
et al., 2011; Kok et al., 2017), but also on the emission, load-   tions to the global dust cycle by using extensive dust aerosol
ing, and deposition generated by individual source regions.        optical depth data from the Moderate Resolution Imaging
However, estimates of the contributions of the world’s major       Spectroradiometer (MODIS) Deep Blue algorithm to obtain
source regions to the global dust cycle diverge widely. For        a fine-grained map of the frequency of activation of dust
instance, model estimates of emissions from the main source        sources. They then used this result to scale emissions in a
regions vary by up to an order of magnitude between differ-        global aerosol model simulation tuned to a specific global
ent global aerosol model simulations (Huneeus et al., 2011;        emission rate (1223 Tg yr−1 for dust up to 12 µm diameter)
Wu et al., 2020).                                                  obtained in a previous modeling study (Ginoux et al., 2001),
   There are several reasons why this poor understanding of        thereby obtaining results for the emission rate generated by
the contribution of each source region to the global dust cy-      each main source region. Another recent study by Albani et
cle hinders quantification of dust impacts on the Earth sys-       al. (2014) regionally tuned model sources to match concen-
tem. First, since dust loading is spatially heterogeneous, con-    tration, deposition, and aerosol optical depth observations us-
straining regional dust loading is a prerequisite to constrain-    ing optimal estimation combined with expert opinion to in-
ing dust impacts on regional climate, weather, air quality, and    corporate geochemical tracer information in dust deposition
the hydrological cycle (Seinfeld et al., 2004; Engelstaedter       measurements. Although both these studies are steps towards
et al., 2006; Huang et al., 2014; Vinoj et al., 2014; Sharma       obtaining more reliable constraints on the contribution of
and Miller, 2017; Kok et al., 2018). Second, dust deposi-          each main source region to the global dust cycle, remaining
tion records indicate that atmospheric dust loading has been       deficiencies include (1) substantial biases in dust microphys-
highly variable between glacial and interglacial periods and       ical properties such as size distribution and extinction effi-
from pre-industrial to modern times (Petit et al., 1999; Mc-       ciency (Adebiyi and Kok, 2020; Adebiyi et al., 2020), (2) the
Connell et al., 2007; Albani et al., 2018; Hooper and Marx,        use of a single model to represent dust transport and emis-
2018). Inferring the impacts of these large changes in dust        sion even though the spread in predictions between models
loading on the Earth system requires knowledge of the ori-         is large (Huneeus et al., 2011; Checa-Garcia et al., 2020; Wu
gin of dust deposited to each measurement site (Mahowald           et al., 2020), and (3) the lack of robust uncertainty estimates
et al., 2010). Finally, many dust impacts on the Earth system      in the contributions of the different source regions that can
are sensitive to dust mineralogy, which varies both within         be propagated into calculated dust impacts such as dust ra-
and between major source regions (Biscaye, 1965; Claquin           diative forcing. As such, although progress has been made in
et al., 1999; Di Biagio et al., 2017). Examples of dust im-        understanding the relative contributions of the world’s source
pacts that are sensitive to mineralogy include dust direct ra-     regions to the global dust cycle, current knowledge is not yet
diative effects (Balkanski et al., 2007; Perlwitz et al., 2015b;   sufficient to constrain regionally varying dust impacts or to
Scanza et al., 2015; Di Biagio et al., 2019), dust interactions    reliably inform the provenance of dust in deposition records.
with clouds through dust serving as ice-nucleating particles          Here we obtain improved constraints on the contributions
(Atkinson et al., 2013; Shi and Liu, 2019), and dust impacts       from the world’s main dust source regions to the global cy-
on biogeochemistry through the deposition of micronutrients        cle of desert dust. We do so in Sect. 2 by building on the
such as iron and phosphorus (Swap et al., 1992; Jickells et        improved representation of the global dust cycle obtained in
al., 2005; Journet et al., 2008; Schroth et al., 2009). Since      a companion paper (Kok et al., 2021a). We obtain a dataset

Atmos. Chem. Phys., 21, 8169–8193, 2021                                             https://doi.org/10.5194/acp-21-8169-2021
J. F. Kok et al.: Contribution of the world’s main dust source regions                                                            8171

that constrains the contributions of nine major source regions
to size-resolved dust emission, loading, dust aerosol optical
depth (DAOD), concentration, and deposition. Our results in
Sect. 3 suggest that most models overestimate the contribu-
tion of African dust to the global dust cycle, while they un-
derestimate the contribution of Asian dust. As discussed in
Sect. 4, our dataset can be used to improve global dust cycle
simulations and to constrain dust impacts on the Earth sys-
tem, including on regional and global climate, weather, air
quality, ecosystems, and the hydrological cycle.

                                                                  Figure 1. Coordinates of the nine main source regions used in
2   Methods                                                       this study. The nine source regions are (1) western North Africa,
                                                                  (2) eastern North Africa, (3) the southern Sahara and Sahel, (4) the
We seek to constrain the contributions of the world’s major       Middle East and central Asia (which includes the Horn of Africa),
source regions to the global dust cycle. We do so by ana-         (5) East Asia, (6) North America, (7) Australia, (8) South Amer-
lyzing constraints obtained in our companion paper (Kok et        ica, and (9) southern Africa. Exact coordinates for these regions are
al., 2021a) on the dust loading, concentration, emission flux,    given in Kok et al. (2021a). After Kok et al. (2021a); made with
wet and dry deposition fluxes, and DAOD generated by each         Natural Earth.
source region. These constraints were obtained through an
analytical framework that used an inverse model to integrate
an ensemble of model simulations with observational con-          analysis of the dust emission, dust loading, and DAOD gen-
straints on dust properties and abundance. Briefly, we used       erated by each source region in the ensemble of AeroCom
simulations from six different global models of dust emit-        Phase I global aerosol model simulations (Huneeus et al.,
ted by nine major source regions (Fig. 1) and for each model      2011) (Sect. 2.2).
particle bin (or mode) extending to a maximum diameter of
                                                                  2.1   Attribution of the global dust cycle to the different
20 µm. These emissions implicitly include both natural and
                                                                        dust source regions
anthropogenic dust and together account for over 99 % of
global low-latitude desert dust emissions (our methodology        The analysis in Kok et al. (2021a) integrated an ensem-
excludes high-latitude dust). We then used optimal estima-        ble of global aerosol model simulations with observational
tion to determine how many units of dust loading from each        constraints on dust properties and abundance to obtain the
source region and particle bin produces the best agreement        size-resolved dust optical depth, column loading, emission
against observational constraints on the dust size distribu-      flux, deposition flux, and concentration for each season and
tion, extinction efficiency, and regional dust aerosol optical    source region. Here we used these inverse modeling results
depth. This approach yielded constraints on the dust load-        to constrain the fractional contribution of each source region
ing, optical depth, concentration, and emission and deposi-       to DAOD (f˘τr,s ), column loading (f˘lr,s ), dust concentration
tion fluxes that are resolved by location, season, and parti-
                                                                  (f˘Cr,s ), and dust deposition flux (f˘Dr,s ). These fields are a
cle size. These constraints include uncertainties propagated
                                                                  function of longitude, latitude, pressure level (P ; in the case
from the spread in model simulation results and in the obser-
                                                                  of dust concentration), and season (subscript s):
vationally informed constraints on dust microphysical prop-
erties and regional DAOD. The companion paper (Kok et al.,                        XNsreg
2021a) showed that this approach resulted in a representa-        f˘τr,s = τ̆r,s / r=1 τ̆r,s ,                                      (1)
tion of the Northern Hemisphere dust cycle that is substan-                       XNsreg
                                                                  f˘lr,s = l˘r,s / r=1 l˘r,s ,                                      (2)
tially more accurate than obtained from a large number of                          XNsreg
climate and chemical transport model simulations and the          f˘Cr,s = C̆r,s / r=1 C̆r,s ,                                      (3)
dust product of the Modern-Era Retrospective analysis for                          XNsreg
Research and Applications Version 2 (MERRA-2; Buchard             f˘Dr,s = D̆r,s / r=1 D̆r,s ,                                      (4)
et al., 2017), with modest improvements for the Southern
Hemisphere dust cycle.                                            where τ̆r,s , l˘r,s , C̆r,s , and D̆r,s are respectively the spatially
   Below, we first describe how we used the results from          resolved bulk DAOD, dust loading, concentration, and total
this inverse model to obtain the fractional contribution to       (wet and dry) deposition flux generated by dust from source
dust loading, concentration, emission flux, wet and dry de-       season r in season s, obtained from the analysis in Kok et
position fluxes, and DAOD generated by each source region         al. (2021a). These four products account for bulk dust with
(Sect. 2.1). For the remainder of this paper, we refer to these   a geometric diameter up to 20 µm (PM20 ). We also obtained
results as the “inverse model results”. We then describe our      the corresponding size-resolved fields for different particle

https://doi.org/10.5194/acp-21-8169-2021                                            Atmos. Chem. Phys., 21, 8169–8193, 2021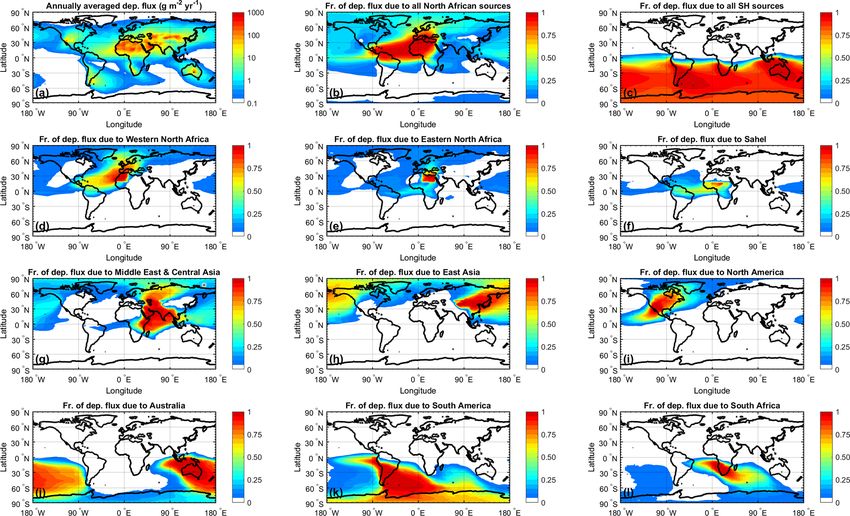
8172                                                   J. F. Kok et al.: Contribution of the world’s main dust source regions

diameter bins k, namely for 0.2–0.5, 0.5–1.0, 1.0–2.5, 2.5–        (both obtained from our inverse model results; see Fig. 3a).
5.0, 5.0–10, and 10–20 µm (see the Supplement for details).        As such, T̆r /T̆glob estimates the ratio of the lifetime of dust
   The DAOD, column loading, concentration, and deposi-            from source region r to the global dust lifetime. This ratio is
tion fields used in Eqs. (1)–(4) are probability distributions     used in Eq. (5) to correct the global dust lifetime simulated
that account for the propagation of errors in the observational    by an AeroCom model to the lifetime for dust emitted from
constraints and modeling results that were used as inputs to       source region r, which in turn is used to calculate the dust
generate these fields (see Sect. 2.5 in Kok et al., 2021a). The    loading generated by source region r from its emission flux.
fractional contributions of each source region to DAOD, col-          We furthermore obtain the DAOD generated by the dust
umn loading, concentration, and deposition flux obtained by        emitted from source region r as simulated by an AeroCom
Eqs. (1)–(4) are thus also probability distributions. We added     model as
the mean and median, the upper and lower 1 standard error
estimates, and the upper and lower 2 standard error estimates                 L̃Aer
                                                                                r           ˘r
                                                                   τ̃rAer =         ˜ Aer       ,                                (6)
to the Dust Constraints from joint Experimental–Modeling–                     AEarth glob ˘glob
Observational Analysis (DustCOMM) dataset (Adebiyi et
                                                                   where AEarth is the Earth’s surface area (m2 ) and ˜globAer is the
al., 2020), which is available at https://dustcomm.atmos.ucla.
edu/ (last access: 13 May 2020).                                   bulk dust mass extinction efficiency (MEE) simulated by a
                                                                   given AeroCom model (obtained from Table 3 in Huneeus
2.2    Obtaining emission, loading, and DAOD per source            et al., 2011). Similar to the approach used in Eq. (5), ˘r and
       region from AeroCom models                                  ˘glob are respectively the bulk dust MEE for source region r
                                                                   and for dust from all source regions (both also obtained from
As described in more detail in the companion paper (Kok et         our inverse model results; see Table 3 in Kok et al., 2021a).
al., 2021a), we analyzed 13 AeroCom Phase I simulations            Note that using T̆r /T̆glob and ˘r /˘glob from our model ensem-
of the dust cycle in the year 2000 (Huneeus et al., 2011) for      ble to approximate the lifetime and MEE per source region
comparison against the inverse model results of the contribu-      in AeroCom models will introduce some error; however, be-
tion of each source region to the global dust cycle. Although      cause T̆r /T̆glob and ˘r /˘glob are dimensionless ratios, we ex-
newer global aerosol model ensembles are available, such as        pect these errors to be relatively small compared to other er-
the AeroCom Phase III (Gliß et al., 2021) and CMIP5 model          rors. This is also indicated by the limited differences between
ensembles (Wu et al., 2020), only the dust component of Ae-        the fractional contributions to emission, loading, and DAOD
roCom Phase I models has been analyzed in sufficient detail        for the different source regions (Fig. 2).
(Huneeus et al., 2011) for comparison against the results of
our study. However, the error of newer model ensembles rel-
ative to various measurements appears to be similar to those       3     Results
for AeroCom Phase I models (see further discussion in Kok
et al., 2021a), and emissions per source region of CMIP5           We report each source region’s contributions to the global
models are relatively similar to those of the AeroCom Phase I      dust cycle on annual and seasonal timescales in Sect. 3.1 and
models analyzed here (see Table 4 in Wu et al., 2020).             3.2, respectively. We then report the spatial distribution of
   Since AeroCom simulations did not track the source re-          dust column loading and DAOD in Sect. 3.3 and the spatial
gion of atmospheric dust after emission, we used our ensem-        distribution of dust deposition fluxes in Sect. 3.4.
ble of model simulations (see Table 1 in Kok et al., 2021a)
                                                                   3.1    Constraints on each source region’s contribution to
to estimate regional differences in the conversion of source-
                                                                          the global dust cycle
specific dust emission to source-specific global loading and
the conversion of source-specific global loading to source-        We obtained each source region’s absolute and fractional
specific global DAOD. Specifically, we estimated the global        contributions to the annual global dust emission and depo-
loading (Tg) generated by dust emitted from source region r        sition flux, the global dust loading, and the global DAOD
as simulated by an AeroCom model as                                (see Table 1 and Fig. 2). For comparison, we also obtained
                                                                   these properties for our ensemble of simulations and for the
                    T̆r                                            AeroCom Phase I model ensemble (see Sect. 2.2).
L̃Aer   Aer Aer
  r = F̃r T̃glob            ,                              (5)
                   T̆glob                                             Our inverse model results on each source region’s contri-
                                                                   bution to the global dust cycle show some notable differ-
where F̃rAer is the bulk emission flux generated by source         ences from our model ensemble and the AeroCom Phase I
region r simulated by a given AeroCom model, T̃glob  Aer is the    ensemble. First, the inverse model results indicate that PM20
global bulk (mass-weighted) dust lifetime simulated by the         dust emission fluxes for all source regions are substantially
AeroCom model (obtained from Table 3 in Huneeus et al.,            greater than most models include (Table 1; also see Kok
2011), and T̆r and T̆glob are respectively the mean bulk life-     et al., 2021a). This is in part because many models simu-
times for source region r and for dust from all source regions     late dust up to a maximum geometric diameter smaller than

Atmos. Chem. Phys., 21, 8169–8193, 2021                                                 https://doi.org/10.5194/acp-21-8169-2021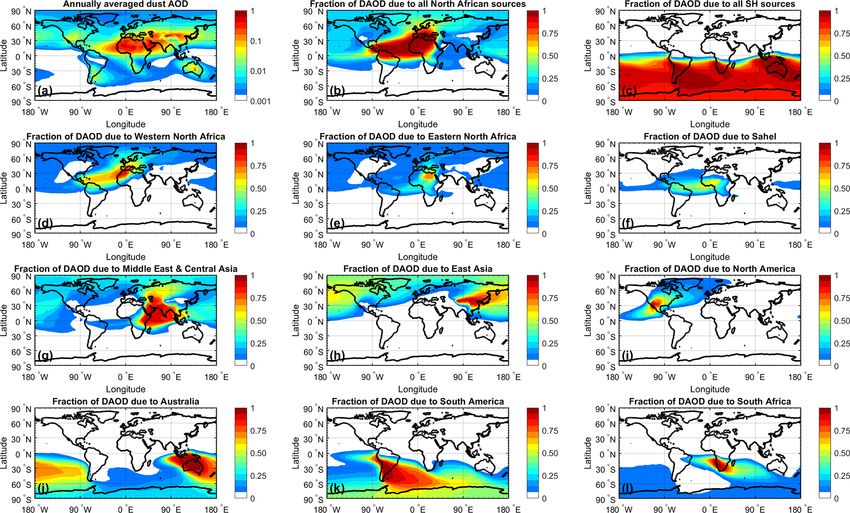
J. F. Kok et al.: Contribution of the world’s main dust source regions                                                            8173

20 µm (see further discussion in Kok et al., 2021a) and in part
because most models that do simulate dust with a diameter
larger than 10 µm substantially underestimate dust emission
and loading in the 10–20 µm diameter range (Adebiyi and
Kok, 2020; Huang et al., 2021). Accounting for this addi-
tional coarse dust in the atmosphere is important because it
produces a substantial direct radiative forcing (Ryder et al.,
2019; Adebiyi and Kok, 2020; Di Biagio et al., 2020) and be-
cause it accounts for a large fraction of dust deposition fluxes
to marine and terrestrial ecosystems (see below).
   A second important difference between our results and
that of the two model ensembles is in the fractional contri-
butions per source region to the global dust cycle. However,
both multi-model ensemble means show that ∼ 60 %–65 %
of dust loading and DAOD is generated by North African
source regions, ∼ 20 %–25 % from the Middle East and cen-
tral Asia, ∼ 5 %–9 % from East Asia, < 1 % from North
America, and ∼ 5 % from the Southern Hemisphere source
regions (Fig. 2b). In contrast, we find that North African
dust contributes only about half of the global dust loading
(1 standard error range of 11–15 Tg) and DAOD (0.013–
0.015). Specifically, we find that the southern Sahara and Sa-
hel source region contributes ∼ 15 % of global dust loading
(with a large one standard error range of 1.6–5.4 Tg) and that
western North Africa (∼ 20 %; 4.2–7.1 Tg) likely contributes
substantially more dust than eastern North Africa (∼ 15 %;         Figure 2. Fractional contribution of each source region to the global
2.2–6.0 Tg). These fractional contributions of western and         dust cycle. Shown are the fractional contributions to the annual
eastern North Africa are substantially less than the average       global dust emission (and deposition) flux (a), the global dust load-
                                                                   ing (b), and the global DAOD (c) for the AeroCom ensemble (pur-
for models in our ensemble and in the AeroCom ensemble,
                                                                   ple boxes; see Sect. 2.2), our model ensemble (green boxes), and for
both of which obtained a ∼ 25 %–30 % contribution for both         the inverse model (orange boxes). Box boundaries approximately
regions. These findings that most models overestimate the          denote the one standard error range (i.e., boxes contain 9 out of 13
fractional contribution of North Africa to global dust loading     AeroCom simulations, 4 out of 6 model ensemble members, and the
and that western North Africa generates a larger dust load-        68 % probability range for the inverse model results), gray circles
ing than eastern North Africa appear to be consistent with         denote the individual simulation results outside this range, whiskers
satellite observations (Engelstaedter et al., 2006; Shindell et    denote the 95 % confidence interval for the inverse model results,
al., 2013). We furthermore find that the ∼ 15 % contribu-          horizontal solid lines denote the median result, and stars denote the
tion of the southern Sahara and Sahel to global dust loading       mean result. Results for each season are shown in Figs. S1–S4.
is similar to that simulated by models in our ensemble but
that AeroCom models simulated a contribution of on aver-
age only ∼ 6 %, thereby possibly underestimating the contri-       count for ∼ 30 % of global dust loading (6.1–9.4 Tg), which
bution from the southern Sahara and Sahel by about a factor        is more than the ∼ 20 %–25 % estimated from the AeroCom
of 2. Our finding of a larger contribution to global dust load-    ensemble and our model ensemble. We further find that East
ing from the southern Sahara and Sahel is consistent with the      Asian source regions account for another ∼ 11 % of global
fact that this source region includes the Bodélé Depression,       dust loading (2.0–3.4 Tg), which is more than the ∼ 7 % es-
which is a major dust source (Warren et al., 2007). Nonethe-       timated from the two model ensembles. Overall, we find that
less, our results add to an emerging consensus (Glaser et al.,     Asian dust accounts for ∼ 40 % of global dust loading.
2015; Bozlaker et al., 2018; Yu et al., 2020) that dust from          We find that the lesser source regions of North and South
the Bodélé Depression accounts for much less than the pre-         America, Australia, and southern Africa account for ∼ 10 %
viously proposed ∼ 50 % of North African dust transported          of the global dust loading (1.8–3.2 Tg). This is substantially
across the Atlantic (Koren et al., 2006; Washington et al.,        more than the ∼ 5 %–6 % of the global dust loading that both
2009; Evan et al., 2015).                                          model ensembles estimate for these minor source regions.
   We find that, after the North African source regions, the       In particular, we find that the relative contribution of North
Asian source regions account for the bulk of the remainder         America to global dust loading is ∼ 2.5 % (0.3–0.9 Tg), or
of global dust emissions, loading, and DAOD. In particu-           ∼ 5 times greater than estimated by both model ensembles
lar, the Middle Eastern and central Asian source regions ac-       (see further discussion in Sect. 3.4.1). Similarly, the rela-

https://doi.org/10.5194/acp-21-8169-2021                                             Atmos. Chem. Phys., 21, 8169–8193, 2021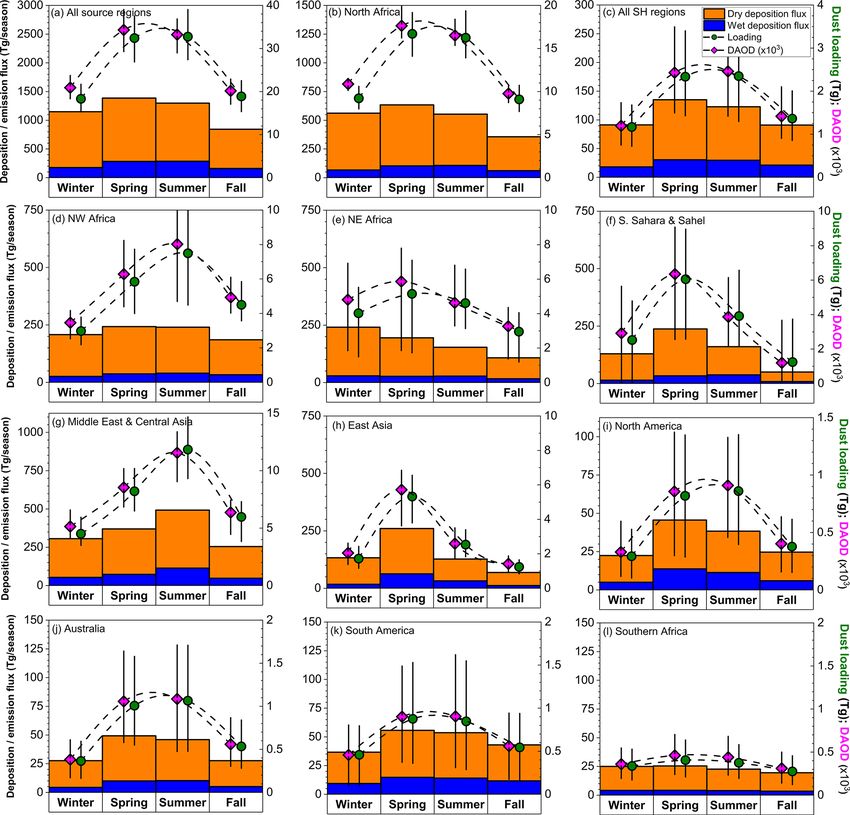
J. F. Kok et al.: Contribution of the world’s main dust source regions
tive contribution of South America is approximately twice as
large (∼ 3 % of global dust loading; 0.4–1.1 Tg). However,
there are large uncertainties in our estimates for these minor
source regions because it is difficult to obtain accurate con-
straints on the DAOD over those regions. In particular, the
contributions of other aerosol species (e.g., sea spray) to to-
tal AOD can be larger than that due to dust (Ridley et al.,
2016), which propagates into large uncertainties for our con-
straint on dust emissions, loading, and DAOD generated by
these source regions (see Table 1). Nonetheless, our results
further confirm that the global dust cycle is dominated by
Northern Hemisphere dust, with Southern Hemisphere dust
The moderate differences between each source region’s
fractional contribution to global dust loading and emission–
deposition fluxes (Fig. 2) are due to differences in the life-
times of dust from each source region (Fig. 3). We find that
atmospheric lifetimes are largest for dust emitted from the
world’s main source regions in North Africa and the Middle
East–central Asia. As discussed in more detail in Sect. 3.2,
this likely occurs because dust emitted from these regions
experiences strong convection, lofting the dust to greater
heights in the atmosphere (Cakmur et al., 2004). The rela-
tively large lifetime of North African dust causes it to account
for half (∼ 50 %) of the global dust loading and DAOD, even
though it accounts for somewhat less than half (∼ 46 %) of
the global PM20 dust emissions (Fig. 2 and Table 1). Dif-
ferences in size-resolved lifetimes between different source
regions (Fig. S5) also drive small differences in the MEE be-
tween the different source regions (Table 1; note that we do
not account for possible regional differences in MEE due to
differences in dust mineralogy; Perlwitz et al., 2015a; Scanza
We further analyzed our results to obtain the seasonality of
each source region’s dust cycle (Fig. 4). We find that only
∼ 15 %–30 % of the total PM20 deposition flux is due to wet
deposition, with some variability with season and source re-
gion. This dominance of deposition fluxes by dry deposition
in all seasons occurs because coarse dust dominates the total
emission flux and those particles are predominantly removed
through dry deposition (e.g., Miller et al., 2006). However,
most of this dry deposition flux is due to coarse dust de-
positing close to source regions, and wet deposition remains
dominant further from source regions (Yu et al., 2019; van
der Does et al., 2020). All source regions show peaks in dust
loading and DAOD in spring or summer, and these seasons
are substantially dustier than the fall and winter seasons for
both the Northern and the Southern Hemisphere. Our results
are consistent with well-known features of the seasonality of
the dust cycle, such as spring and summertime peaks in Saha-
ran dust loading, springtime peaks in Sahelian and East Asian
dust loading, and spring and summertime peaks in Australian
https://doi.org/10.5194/acp-21-8169-2021
Seasonality of each source region’s dust cycle
accounting for less than 10 % of global dust loading.
et al., 2015).
3.2
Table 1. Contributions of the world’s nine major source regions to the global dust cycle. Listed are median values for the AeroCom Phase I ensemble and the inverse model results, with
1 standard error intervals listed in parentheses. For the AeroCom ensemble, the 1 standard range was obtained from the range spanned by the 9 central model results out of the 13 total
model results, which corresponds to the central 69 % of model results. For the inverse model results, the 1 error range was obtained from the central 68 % of results from a large number
(103 ) of bootstrap iterations (see Kok et al., 2021a). Note that inverse model results are for dust with D ≤ 20 µm, whereas the size range accounted for by AeroCom models differs for
each model (see Huneeus et al., 2011).
Atmos. Chem. Phys., 21, 8169–8193, 2021
Source region Annual dust emission Percentage of annual dust Dust loading (Tg) Percentage of dust loading Dust AOD (×103 ) Percentage of dust AOD Mass extinction
and deposition rat emission and deposition efficiency (m2 g−1 )
(×103 Tg yr−1 )
AeroCom Inverse model AeroCom Inverse model AeroCom Inverse model AeroCom Inverse model AeroCom Inverse model AeroCom Inverse model AeroCom Inverse model
All source regions 1.7 (1.2–3.1) 4.7 (3.4–9.1) 100 (99–100)∗ 100 (99–100)∗ 20 (14–23) 26 (22–30) 100 (99–100) 100 (99–100) 30 (21–35) 27 (24–30) 100 (99–100) 100 (99–100) 0.69 (0.60–0.96) 0.54 (0.47–0.62)
All of North Africa 1.0 (0.5–1.7) 2.1 (1.6–4.3) 60 (55–69) 46 (44–49) 12 (8–18) 13 (11–15) 66 (59–74) 50 (47–55) 20 (13–22) 14 (13–15) 66 (60–74) 50 (48–55) 0.69 (0.61–0.97) 0.55 (0.48–0.63)
All of the Southern Hemisphere 0.10 (0.03–0.20) 0.47 (0.30–0.78) 6 (2–11) 9 (7–12) 0.9 (0.3–1.5) 1.8 (1.3–2.4) 5 (1–8) 7 (5–9) 1 (0–2) 2 (1–2) 5 (1–8) 7 (5–9) 0.65 (0.57–0.93) 0.53 (0.47–0.61)
Western North Africa 0.41 (0.28–0.60) 0.88 (0.64–1.44) 24 (19–37) 18 (14–22) 5.0 (3.3–6.2) 5.2 (3.8–6.9) 27 (22–40) 19 (16–26) 7.4 (5.2–11.1) 5.6 (4.2–7.1) 27 (22–40) 19 (16–26) 0.68 (0.60–0.97) 0.55 (0.48–0.63)
Eastern North Africa 0.44 (0.27–0.82) 0.72 (0.47–1.11) 26 (20–33) 16 (7–21) 5.3 (3.8–8.2) 4.3 (2.0–5.5) 28 (21–34) 16 (8–21) 8.1 (6.0–10.5) 4.8 (2.2–6.0) 29 (22–35) 17 (8–22) 0.70 (0.62–0.99) 0.56 (0.49–0.64)
Southern Sahara and Sahel 0.10 (0.03–0.29) 0.56 (0.15–1.77) 6 (2–14) 13 (4–20) 1.4 (0.4–2.1) 3.5 (1.5–5.6) 7 (2–15) 14 (6–22) 2.1 (0.5–2.7) 3.8 (1.6–5.4) 7 (2–15) 13 (6–22) 0.69 (0.61–0.98) 0.53 (0.46–0.61)
Middle East/central Asia 0.34 (0.19–0.56) 1.38 (0.97–2.59) 21 (17–28) 29 (27–32) 4.5 (1.8–5.7) 7.7 (6.0–9.3) 20 (16–27) 30 (26–32) 4.9 (4.0–8.0) 8.0 (6.4–9.1) 19 (16–27) 29 (25–32) 0.66 (0.59–0.94) 0.52 (0.46–0.60)
East Asia 0.18 (0.02–0.31) 0.58 (0.42–1.12) 9 (2–20) 13 (10–15) 1.8 (0.2–2.7) 2.7 (2.0–3.4) 7 (2–17) 11 (9–12) 2.1 (0.4–5.9) 3.0 (2.0–3.6) 7 (2–17) 11 (8–13) 0.70 (0.62–0.99) 0.53 (0.46–0.63)
North America 0.01 (0.00–0.01) 0.13 (0.05–0.24) 0 (0–1) 3 (1–4) 0.1 (0.0–0.1) 0.6 (0.3–0.9) 0 (0–0) 2 (1–3) 0.1 (0.0–0.1) 0.6 (0.4–0.9) 0 (0–0) 2 (1–3) 0.67 (0.59–0.94) 0.54 (0.46–0.64)
Australia 0.04 (0.01–0.09) 0.16 (0.09–0.29) 4 (1–6) 3 (2–5) 0.3 (0.1–0.9) 0.8 (0.5–1.1) 3 (1–5) 3 (2–4) 0.4 (0.2–1.1) 0.8 (0.5–1.1) 3 (1–5) 3 (2–4) 0.64 (0.57–0.91) 0.53 (0.46–0.61)
South America 0.02 (0.00–0.07) 0.19 (0.10–0.35) 2 (0–3) 4 (2–6) 0.1 (0.0–0.5) 0.7 (0.4–1.1) 1 (0–2) 3 (2–4) 0.1 (0.0–0.5) 0.7 (0.4–1.1) 1 (0–2) 3 (2–4) 0.65 (0.57–0.91) 0.52 (0.45–0.60)
Southern Africa 0.02 (0.01–0.05) 0.10 (0.06–0.19) 1 (1–3) 2 (1–3) 0.2 (0.1–0.4) 0.4 (0.2–0.5) 1 (1–2) 1 (1–2) 0.4 (0.1–0.5) 0.4 (0.3–0.5) 1 (1–2) 1 (1–2) 0.69 (0.61–0.97) 0.57 (0.50–0.66)
∗ The fraction of global emissions of desert dust accounted for by the nine source regions is calculated by using simulated global emissions in the latitude band of 50◦ S–50◦ N. This was done to exclude high-latitude dust emissions, which the inverse model does not account for.
8174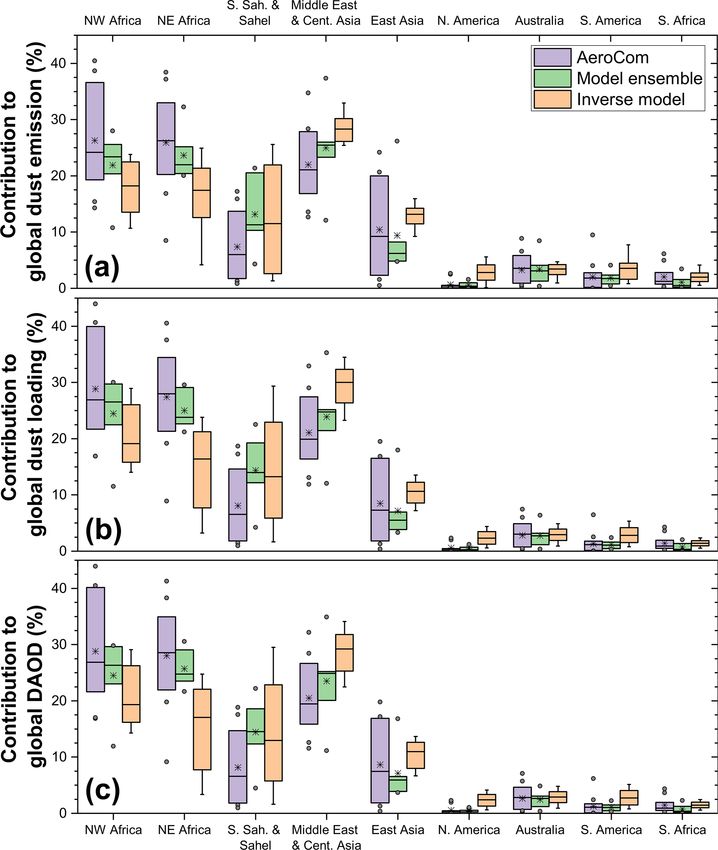
J. F. Kok et al.: Contribution of the world’s main dust source regions                                                                  8175

Figure 3. Seasonal variation of dust lifetime for the different source regions. (a) Mass-weighted lifetime of PM20 dust for each source region
on an annual basis (A; brown bars) and for each source region’s local winter (W), spring (S), summer (U), and fall (F) seasons (magenta,
green, orange, and blue bars). Variations in dust lifetime are largely explained by differences in downwelling SW flux (panel b) and planetary
boundary layer (PBL) height (panel c). This indicates that the increased modeled dust lifetime in spring and summer is due to increased
convection, which lofts dust to greater altitudes. The colors of the symbols in panels (b) and (c) denote the season per the color scheme in
panel (a). The TOA downwelling SW flux was obtained from Wong and Chow (2001), the seasonally averaged PBL height was obtained
from the GISS Model E2.1 simulation (Kelley et al., 2020), and the mass-weighted dust lifetimes were obtained from the ratio of the PM20
dust loading to the deposition flux for each source region and season. Size-resolved annual and seasonal dust lifetimes of the individual
model ensemble simulations used in the inverse model are shown in Figs. S5–S9.

dust loading (Goudie and Middleton, 2001; Prospero et al.,               in fall is longer than in summer (Fig. 3a), which appears
2002; Ekstrom et al., 2004; Ginoux et al., 2012; Knippertz               to be due to increased wet deposition (Fig. 4f), presumably
and Todd, 2012; Xu et al., 2016).                                        due to proximity to the Intertropical Convergence Zone and
   We find that an important contributor to the peaks in dusti-          the West African monsoon in summer (Glaser et al., 2015).
ness in spring and summer is an enhanced dust lifetime dur-              Nonetheless, we find that most of the variance in dust life-
ing those seasons (Fig. 3). A multi-linear regression analy-             time between seasons and source regions is explained by dif-
sis shows that, on average, approximately one-quarter of the             ferences in the planetary boundary layer depth (R 2 = 0.86;
variance in seasonal dust loading is explained by the sea-               Fig. 3b), which in turn are largely due to differences in the
sonal variability in lifetime, approximately one-third is ex-            top-of-atmosphere shortwave downwelling flux (R 2 = 0.86;
plained by the seasonal variability in emissions, and the rest           Fig. 3c).
of the variance is explained by the correlation between emis-
sions and lifetime. In fact, several source regions do not show          3.3    Spatial distribution of each source region’s
a clear peak in emissions during spring and summer (i.e.,                       contribution to DAOD, column loading, and
western and eastern North Africa and southern Africa) but                       concentration
nonetheless show clear peaks in loading and DAOD that are
driven by the increased lifetime in those seasons. This sea-             Consistent with the ∼ 50 % fractional contribution of North
sonality in the lifetime is likely driven by the stronger con-           African source regions to the global DAOD, we find that
vection in spring and summer, lofting emitted dust to greater            North African dust contributes substantially to DAOD and
heights in those seasons when solar insolation is largest.               loading in most of the Northern Hemisphere, with dust from
One exception might be the Sahel, for which the lifetime                 East Asia and the Middle East–central Asia also contribut-

https://doi.org/10.5194/acp-21-8169-2021                                                    Atmos. Chem. Phys., 21, 8169–8193, 2021
8176                                                        J. F. Kok et al.: Contribution of the world’s main dust source regions

Figure 4. Seasonal contributions of each source region to the global dust cycle. Shown are the seasonal cycles of the wet deposition flux (blue
bars and left axis), dry deposition flux (orange bars and left axis), dust loading (green circles and right axis), and DAOD (magenta diamonds
and right axis) generated by (a) all source regions, (b) all North African source regions, (c) all Southern Hemisphere source regions, and (d–
l) each of the nine individual source regions. The sum of the seasonal wet and dry deposition fluxes is approximately equal (within a few
percent) to the seasonal dust emission flux generated by each source region. Results for loading and DAOD are slightly offset horizontally
for clarity. Seasons refer to boreal seasons for global results (a) and to local seasons for all other panels. Note that the vertical axis scale
differs between source regions. Error bars denote 1 standard error from the median; error bars on deposition fluxes usually exceeded 100 %
and are not included for clarity.

ing substantially in several regions (Figs. 5 and S11). How-              sphere is overwhelmingly supplied by the Australian, South
ever, the Intertropical Convergence Zone (ITCZ) poses a                   American, and southern African source regions.
formidable barrier to the interhemispheric transport of dust                 Constraints on the zonally averaged dust concentration
from these major Northern Hemisphere source regions (see                  provide further insight into the contribution of the different
also the seasonal DAOD and loading results in Figs. S12–                  source regions throughout the three-dimensional (3D) atmo-
S19). Even though Northern Hemisphere dust accounts for                   sphere (Fig. 6). We find that the interhemispheric transport
∼ 93 % of the global dust loading, it contributes only up                 of Northern Hemisphere (NH) dust is likely facilitated by
to ∼ 10 % to the dust loading south of the ITCZ. Note that                strong vertical transport shown by dust emitted from the arid
this result depends sensitively on the ability of models to               North African and Asian deserts (Fig. 6d–h), which prob-
represent interhemispheric transport. Although other mod-                 ably drives the longer lifetimes of dust emitted from those
eling studies have found somewhat different contributions                 regions (Fig. 3). Consequently, the cross-equatorial trans-
of Northern Hemisphere source regions to Southern Hemi-                   port of dust originating from the NH makes the largest frac-
sphere dust (e.g., Li et al., 2008; Albani et al., 2012), our re-         tional contribution to the concentration in the SH strato-
sults support the conclusion that dust in the Southern Hemi-              sphere (< 200 hPa; Fig. 6d–h), although transport into this
                                                                          region could be distorted by model errors in the middle at-

Atmos. Chem. Phys., 21, 8169–8193, 2021                                                       https://doi.org/10.5194/acp-21-8169-2021
J. F. Kok et al.: Contribution of the world’s main dust source regions 8177 Figure 5. Attribution of the annually averaged DAOD to the world’s main dust source regions. Shown first is (a) the annually averaged DAOD produced from all source regions combined, followed by the fraction of DAOD that is due to (b) all North African and (c) all Southern Hemisphere source regions. The fraction of DAOD due to each of the three North African source regions is shown in panels (d)–(f), and the fraction of DAOD due to the other three Northern Hemisphere source regions of the Middle East and central Asia, East Asia, and North America is shown in panels (g)–(i). Finally, the fraction of DAOD due to the three Southern Hemisphere source regions of Australia, South America, and southern Africa is shown in panels (j)–(l). Attributions of seasonal DAOD to the different source regions are shown in Figs. S12–S15. mosphere circulation that result from insufficient vertical res- the models in our ensemble as we have not incorporated ob- olution and an artificially low upper boundary (e.g., Rind servational constraints on dust vertical profiles. Since com- et al., 2020). In the SH upper troposphere, dust originates parisons of model simulations against data from the Cloud– mainly from austral sources (Fig. 6c). Although dust concen- Aerosol Lidar with Orthogonal Polarization (CALIOP) and trations are small at this altitude (Fig. 6a), dust there could the Cloud–Aerosol Transport System (CATS) airborne lidars be critical for the heterogeneous nucleation of cirrus (Cziczo indicate substantial discrepancies (Yu et al., 2010; Kim et et al., 2013) and mixed-phase clouds (Vergara-Temprado et al., 2014; Koffi et al., 2016; O’Sullivan et al., 2020), results al., 2018), which could have important impacts on climate presented here likely suffer from similar biases. A future ver- (Storelvmo, 2017). Overall, we find that ∼ 0.4 % of PM20 sion of this product could thus use dust extinction profiles re- dust emitted in the NH is transported to the SH, whereas only trieved from CALIOP (Omar et al., 2010; Song et al., 2021), ∼ 0.2 % of PM20 dust emitted in the SH is transported to the CATS (Yorks et al., 2014) or in situ measurements (Brock et NH. As such, interhemispheric dust transport is quite rare, al., 2019) to constrain the vertical distribution of dust. and transport of dust from the SH to the NH is even less ef- ficient than from the NH to the SH (Fig. 6c, j, k, l). Likely 3.4 Constraints on each source region’s contribution to reasons for this include the fact that SH dust has a lower av- dust deposition fluxes erage lifetime than NH dust (Fig. 3) and is emitted further from the Equator and the summer ITCZ than dust from, for We used our results to attribute the dust deposition flux to the instance, North Africa and the Middle East. different major source regions (Figs. 7 and 8a). These results It is important to note that the inverse model’s vertical dis- strongly mirror the attribution of dust loading and DAOD. tribution of dust is largely determined by that simulated by For instance, North African dust accounts for ∼ 20 %–100 % https://doi.org/10.5194/acp-21-8169-2021 Atmos. Chem. Phys., 21, 8169–8193, 2021
8178                                                        J. F. Kok et al.: Contribution of the world’s main dust source regions

Figure 6. Attribution of the zonally averaged and annually averaged PM20 dust concentration to the world’s main source regions.
Panel (a) shows the zonally averaged dust mixing ratio (dust concentration normalized by air density) as a function of latitude (horizon-
tal axis) and pressure (hPa; vertical axis). Panels (b)–(l) show the partition of the dust concentration per source region, with panel ordering
identical to Fig. 5. The seasonally resolved attribution of the zonally averaged dust concentration is shown in Figs. S20–S23.

of dust deposition in much of the Northern Hemisphere                     darkening from increasing dust deposition has played an im-
(Fig. 7b). Dust from East Asia and the Middle East–central                portant role in the regional warming of this region (Lau et al.,
Asia accounts for the bulk of the remaining dust deposition               2010; Sarangi et al., 2020).
and dominates in large regions near the respective source                    Greenland receives a relatively smaller dust deposition
regions (Figs. 7g, h, 8a). We also find that Northern Hemi-               flux of 0.19 (0.07–0.52) Tg that is supplied by several differ-
sphere dust contributes only a few percent of dust deposition             ent source regions, namely Northern Africa (30 (19–45) %),
fluxes throughout most of the Southern Hemisphere (Fig. 7c;               East Asia (26 (14–32) %), and North America (26 (11–
Tables 2 and 3).                                                          50) %) (note that we constrain deposition of desert dust only
                                                                          and thus do not include deposition of dust from high-latitude
3.4.1   Dust deposition to high-albedo regions                            sources supplied by glacial sediments, which is likely an im-
                                                                          portant contributor at the coastal margins of Greenland; Bory
We also constrained the deposition fluxes to land regions                 et al., 2003; Bullard et al., 2016). Our finding that North
for which dust deposition produces important impacts (Ta-                 American dust contributes substantially to dust deposited to
ble 2). This includes the snow- and ice-covered regions of                Greenland (Figs. 7i, 8a) seems to disagree with geochemi-
Antarctica, the Arctic, and the Tibetan Plateau (Lee et al.,              cal data, which thus far have not identified a clear contri-
2017; Kylling et al., 2018; Sarangi et al., 2020). Dust depo-             bution from North American dust (Bory et al., 2003). This
sition to these high-albedo regions can darken snow and ice               suggests that our results might overestimate North American
packs, thereby producing warming and accelerating melting                 dust emission, which is approximately a factor of 5 larger
(Painter et al., 2010; Shao et al., 2011; Mahowald et al., 2014;          than predicted by most models in both the AeroCom Phase
Skiles et al., 2018). We find that the Tibetan Plateau, being             I ensemble and in our own model ensemble (Fig. 2 and Ta-
adjacent to major East Asian source regions (e.g., the Tak-               ble 1). This overestimation would most likely be due to an
limakan Desert), receives a large deposition flux of 16 (11–              overestimate of the DAOD over North America that we used
25) Tg yr−1 . This is consistent with findings that snowpack              to constrain regional emissions (Kok et al., 2021a). This re-

Atmos. Chem. Phys., 21, 8169–8193, 2021                                                      https://doi.org/10.5194/acp-21-8169-2021
J. F. Kok et al.: Contribution of the world’s main dust source regions 8179
Figure 7. Attribution of the annually averaged deposition flux of PM20 dust to the world’s main source regions. Panel ordering is identical
to Fig. 5, and the seasonally resolved attribution of the dust deposition flux is shown in Figs. S25–S28.
gional DAOD was obtained from an ensemble of aerosol re- position flux to Antarctica equals 0.14 (0.03–0.55) Tg, the
analysis products (Adebiyi et al., 2020), which might thus bulk of which is provided by South America (∼ 70 %), with
overestimate DAOD over North America. Furthermore, the smaller contributions from Australia (∼ 20 %) and southern
inverse model finding of roughly equal contributions of the Africa (∼ 10 %) and almost no contribution from NH dust
East Asian and North African source regions to dust depo- (Fig. 7 and Table 2). As such, South America is the dom-
sition to Greenland is in mixed agreement with geochemical inant dust source region for almost the entire continent of
data. These data indicate that East Asia is the main source Antarctica (Fig. 8a). These findings are in good agreement
of dust deposited to several ice core sites in the interior of with ice core records, for which geochemical fingerprinting
Greenland (Bory et al., 2002, 2003), with dust from North has indicated that most present-day deposited dust originates
Africa probably contributing as a secondary source (Lup- from South America, with a smaller contribution from Aus-
ker et al., 2010). This possible disagreement between the tralia (Mosley-Thompson et al., 1990; Souney et al., 2002;
inverse model results and geochemical data is noteworthy, McConnell et al., 2007; Delmonte et al., 2008; Bory et al.,
as the inverse model shows a substantially greater contribu- 2010; Delmonte et al., 2019).
tion from East Asian dust and a smaller contribution from
North African dust than most models in both model ensem- 3.4.2 Dust deposition to the Amazon rainforest
bles (see Fig. 2 and Table 1). As such, the underestimation
of Asian dust and overestimation of African dust relative to We also obtained the dust deposition flux to the Amazon rain-
results from geochemical studies would be larger for models forest, for which the productivity on timescales of decades to
in the two ensembles than for the inverse model. This finding millennia is partially controlled by delivery of phosphorus
suggests that current models either substantially underesti- by settling dust (Swap et al., 1992; Okin et al., 2004). We
mate transport of East Asian dust or overestimate transport find that the Amazon rainforest receives an average annual
of North African dust to Greenland. dust flux of 0.9 (0.3–1.1) g m−2 yr−1 , which corresponds to
We also quantified each source region’s contribution to a total annual dust deposition flux of 8.5 (2.9–9.7) Tg yr−1
dust deposited to Antarctica. We find that the total dust de- (Table 3). This is similar to results from the (unmodified)
simulations in our ensemble, which predict a median Ama-
https://doi.org/10.5194/acp-21-8169-2021 Atmos. Chem. Phys., 21, 8169–8193, 20218180 J. F. Kok et al.: Contribution of the world’s main dust source regions
Table 2. Constraints on the contribution of dust deposition from each source region to land areas where dust deposition produces important
impacts, namely the high-albedo regions of Antarctica, Greenland, and the Tibetan Plateau, as well as the Amazon rainforest. Listed are
median values, with 1 standard error intervals listed in parentheses. The coordinates of the Amazon rainforest follow the definition given in
Yu et al. (2015), and the Tibetan Plateau was taken as the region with elevation over 4000 m between 26–40◦ N and 75–105◦ E based on
Easter et al. (2004). These regions are plotted in Fig. S24.
Source region Antarctica Greenland Tibetan Amazon All land
Plateau rainforest regions
Total deposition 0.14 0.19 16 8.5 3.8
from all source (0.03–0.55) (0.07–0.52) (11–25) (2.9–9.7) (2.7–7.5) × 103
regions (Tg yr−1 )
Percentage from
North African 0 (0–1) 30 (19–45) 4 (2–6) 90 (86–94) 47 (45–50)
source regions
Southern Hemisphere 99 (98–100) 0 (0–5) 0 (0–0) 6 (4–12) 7 (5–8)
source regions
Western 0 (0–0) 18 (13–32) 1 (1–2) 41 (28–53) 19 (14–22)
North Africa
Eastern 0 (0–0) 6 (4–12) 2 (0–3) 11 (6–24) 17 (7–22)
North Africa
S. Sahara 0 (0–1) 3 (1–5) 1 (0–1) 36 (16–53) 13 (5–22)
and Sahel
Middle East and 0 (0–1) 11 (7–19) 18 (14–30) 2 (2–3) 29 (26–32)
central Asia
East Asia 0 (0–0) 26 (14–32) 77 (67–82) 0 (0–0) 14 (11–17)
North America 0 (0–0) 26 (11–50) 0 (0–0) 0 (0–0) 3 (1–4)
Australia 18 (6–36) 0 (0–1) 0 (0–0) 0 (0–0) 3 (2–4)
South America 71 (50–90) 0 (0–2) 0 (0–0) 5 (2–11) 2 (1–3)
Southern Africa 8 (3–13) 0 (0–2) 0 (0–0) 1 (0–2) 1 (1–2)
zon deposition flux of 11.0 Tg and a range of 4.4–14.8 Tg. man et al. (2005), which is less than the globally integrated
Further, our results are quantitatively similar to the Ama- mass extinction efficiencies of ∼ 0.68 and ∼ 0.54 m2 g−1
zon dust deposition flux of 8–10 Tg yr−1 obtained by Pros- predicted by AeroCom models and obtained here (Table 1),
pero et al. (2020) based on dust measurements at Cayenne respectively. Furthermore, the MEE for dust near the Ama-
(French Guiana) and the MERRA-2 dust product (Buchard et zon rainforest is larger than the globally integrated MEE
al., 2017; Randles et al., 2017). Note that these results might (Fig. S10) because most coarse particles deposit during long-
somewhat underestimate deposition fluxes because most cur- range transport across the Atlantic. Indeed, the recent Dust-
rent models are unable to simulate the long-range transport COMM dataset (Adebiyi et al., 2020), which explicitly ac-
of super-coarse dust with D>10 µm (Ansmann et al., 2017; counts for the enhancement of dust extinction due to par-
Weinzierl et al., 2017). ticle asphericity, shows an MEE of ∼ 0.8–1.0 m2 g−1 after
The Amazon deposition fluxes found here (for the years trans-Atlantic transport of North African dust. This is in good
2004–2008) and in Prospero et al. (2020) are a factor of ∼ 2– agreement with available measurements (Li et al., 1996;
3 less than the 28 (8–50) Tg yr−1 obtained from an analysis Denjean et al., 2016; Figs. 8 and 9 in Adebiyi et al., 2020).
of 2007–2013 data from the CALIOP satellite instrument by We similarly find that the MEE over the Amazon rainfor-
Yu et al. (2015). Our lower estimate of dust deposition for the est is 0.86 (0.76–1.05) m2 g−1 such that the CALIOP-derived
Amazon rainforest is expected because the CALIOP study results likely underestimate the MEE by a factor of ∼ 2–3,
substantially underestimated the dust extinction efficiency far thereby overestimating deposition fluxes by the same fac-
from source regions. Indeed, the CALIOP estimates used a tor. Taking this bias in the assumed MEE into account would
mass extinction efficiency (MEE) of 0.37 m2 g−1 after Kauf- bring the CALIOP-derived deposition fluxes into agreement
Atmos. Chem. Phys., 21, 8169–8193, 2021 https://doi.org/10.5194/acp-21-8169-2021J. F. Kok et al.: Contribution of the world’s main dust source regions 8181
measurements (see Kok et al., 2021a). In addition, our ap-
proach integrates a variety of regional measurements ranging
from AOD to dust size distributions along with model esti-
mates of transport, in contrast to observational estimates of
nutrient supply based upon a more limited range of observa-
tions or retrievals. A further advantage of the constraints pre-
sented here is that they are source-region-resolved and avail-
able globally. This former factor is particularly important for
accounting for the effects of regional differences in soil min-
eralogy on dust impacts on radiation (Perlwitz et al., 2015a;
Scanza et al., 2015), clouds (Liu et al., 2012; Atkinson et al.,
2013; Shi and Liu, 2019), and biogeochemistry (Zhang et al.,
2015), as well as for interpreting records of dust deposition
from natural archives (Albani et al., 2015).
Our results also provide insight into the source regions that
provide dust to the Amazon rainforest (Fig. 8b). Previous
studies have argued that either the Bodélé Depression (Ko-
ren et al., 2006) or El Djouf (Yu et al., 2020) are dominant
contributors to dust deposition to the Amazon. However, we
find that the western North Africa source region (contain-
ing El Djouf) and the southern Sahara and Sahel source re-
Figure 8. Percentage of dust deposition supplied by the dominant gion (containing the Bodélé Depression) contribute roughly
source region at each location for (a) the entire globe and (b) the equally to the Amazonian dust deposition flux. Indeed, west-
Amazon rainforest. Different colors represent different dominant ern North Africa contributes 41 (28–53) % and dominates
source regions, with shading decreasing in 10 % increments from the deposition flux in the northern part of the Amazon rain-
a maximum of 100 % to a minimum of 20 %. The 50 % contour is forest, whereas the southern Sahara and Sahel contribute 36
identified by a black dotted line, and white shading denotes areas
(16–53) % and dominate in the central and eastern parts of
where two or more dust source regions contribute similarly to the
deposition flux. The black boxes in panel (a) denote the nine major
the Amazon rainforest. The contribution of both the west-
source regions, and the black box in panel (b) denotes the bound- ern North Africa and the southern Sahara and Sahel source
aries of the Amazon rainforest used here based on Yu et al. (2015). regions peak in boreal spring, with smaller contributions in
Also shown is (b) Cayenne, the location of the field site where Pros- winter and summer (Figs. S25–S28). Most of the remain-
pero et al. (2020) obtained dust measurements (see text). der of the dust deposition flux is supplied by eastern North
African dust (11 (6–24) %) and notably by South American
dust (5 (2–11) %), which dominates in the southwestern part
with our results. These results emphasize the need for ac- of the Amazon. Overall, our results thus indicate that a large
curate and spatially varying constraints on the MEE, such as number of different source regions make important contribu-
provided here and in Adebiyi et al. (2020) as part of the Dust- tions to dust deposition to the Amazon rainforest.
COMM dataset. Overall, our results add to a growing con-
sensus that, although the dust-borne delivery of phosphorus 3.4.3 Dust deposition to oceanic regions
is likely critical for the long-term productivity of the Ama-
zon rainforest, these fluxes are substantially less than previ- We further used our results to quantitatively constrain the
ously thought and are rivaled by the delivery of more solu- PM20 dust deposition flux of each source region to each
ble phosphorus by biomass burning aerosols from southern ocean basin (Table 3). Dust deposition provides critical nu-
Africa (Barkley et al., 2019; Prospero et al., 2020). trients, such as phosphorus and iron, to open-ocean regions
Our finding of a substantially lower deposition flux to the such as the Southern Ocean and the North Pacific where pri-
Amazon rainforest illustrates the advantages of integrating mary productivity can be limited by the supply of these dust-
observational, experimental, and modeling constraints. Re- borne nutrients (Jickells et al., 2005; Myriokefalitakis et al.,
sults from analyses of model simulations and satellite data 2018). Consequently, glacial–interglacial variations in atmo-
are subject to possibly substantial biases due to a number of spheric dust deposition flux to the oceans are hypothesized
required assumptions, including regarding the optical prop- to have modulated atmospheric CO2 concentrations (Mar-
erties and size distribution of dust. In our approach, dust tin, 1990; Ridgwell and Watson, 2002; Lambert et al., 2008).
properties are instead based on observational constraints for We constrain the total flux of PM20 dust deposited to oceans
which the uncertainties have been propagated into our results to be 0.8 (0.6–1.3) × 103 Tg. This is approximately double
(Kok et al., 2017; Adebiyi and Kok, 2020) and for which the median deposition flux to oceans that was obtained in re-
quantitative predictions can be evaluated against independent cent model ensemble studies (Table 5 in Checa-Garcia et al.,
https://doi.org/10.5194/acp-21-8169-2021 Atmos. Chem. Phys., 21, 8169–8193, 2021You can also read