Global and northern-high-latitude net ecosystem production in the 21st century from CMIP6 experiments
←
→
Page content transcription
If your browser does not render page correctly, please read the page content below
Research article
Earth Syst. Dynam., 14, 1–16, 2023
https://doi.org/10.5194/esd-14-1-2023
© Author(s) 2023. This work is distributed under
the Creative Commons Attribution 4.0 License.

            Global and northern-high-latitude net ecosystem
         production in the 21st century from CMIP6 experiments
                          Han Qiu1,a , Dalei Hao2 , Yelu Zeng1 , Xuesong Zhang3 , and Min Chen1
             1 Department
                        of Forest and Wildlife Ecology, University of Wisconsin-Madison, Madison, WI, USA
                                  2 Atmospheric Sciences and Global Change Division,

                              Pacific Northwest National Laboratory, Richland, WA, USA
                3 USDA-ARS Hydrology and Remote Sensing Laboratory, Beltsville, MD 20705-2350, USA
                              a now at: Atmospheric Sciences and Global Change Division,

                              Pacific Northwest National Laboratory, Richland, WA, USA
                   Correspondence: Han Qiu (han.qiu@pnnl.gov) and Min Chen (min.chen@wisc.edu)

                                     Received: 31 May 2022 – Discussion started: 7 June 2022
                        Revised: 20 October 2022 – Accepted: 15 November 2022 – Published: 9 January 2023

       Abstract. Climate warming is accelerating the changes in the global terrestrial ecosystems and particularly
       those in the northern high latitudes (NHLs; poleward of 50◦ N) and rendering the land–atmosphere carbon ex-
       change highly uncertain. The Coupled Model Intercomparison Project Phase 6 (CMIP6) employs the most up-
       dated climate models to estimate terrestrial ecosystem carbon dynamics driven by a new set of socioeconomic
       and climate change pathways. By analyzing the future (2015–2100) carbon fluxes estimated by 10 CMIP6 mod-
       els, we quantitatively evaluated the projected magnitudes, trends, and uncertainties in the global and NHL carbon
       fluxes under four scenarios plus the role of NHLs in the global terrestrial ecosystem carbon dynamics. Overall,
       the models suggest that the global and NHL terrestrial ecosystems will be consistent carbon sinks in the future,
       and the magnitude of the carbon sinks is projected to be larger under scenarios with higher radiative forcing. By
       the end of this century, the models on average estimate the NHL net ecosystem productivity (NEP) as 0.54 ± 0.77,
       1.01 ± 0.98, 0.97 ± 1.62, and 1.05 ± 1.83 Pg C yr−1 under SSP126, SSP245, SSP370, and SSP585, respectively.
       The uncertainties are not substantially reduced compared with earlier results, e.g., the Coupled Climate–Carbon
       Cycle Model Intercomparison Project (C4MIP). Although NHLs contribute a small fraction of the global carbon
       sink (∼ 13 %), the relative uncertainties in NHL NEP are much larger than the global level. Our results provide
       insights into future carbon flux evolutions under future scenarios and highlight the urgent need to constrain the
       large uncertainties associated with model projections for making better climate mitigation strategies.

1   Introduction                                                   with an additional 1.6 Pg C yr−1 loss due to land use change
                                                                   (Friedlingstein et al., 2020). However, these numbers of
The global terrestrial biosphere is considered to be a ma-         land–atmosphere carbon fluxes, especially the photosynthe-
jor carbon pool and a key player in the global carbon cy-          sis and respiration components, change over time in response
cle. In the last decade (2011–2020), the terrestrial biosphere     to climate change and are associated with large uncertain-
has absorbed CO2 from the atmosphere at a rate of about            ties. For example, using trace gas measurements, Campbell et
120 Pg C yr−1 by vegetation photosynthesis and released a          al. (2017) estimated a large increase in global terrestrial bio-
similar amount of carbon back to the atmosphere through            sphere photosynthetic carbon uptake of 31 % over the 20th
respirations from plant metabolism and microbial activi-           century accompanied by rapidly rising CO2 concentration
ties (i.e., autotrophic and heterotrophic respirations) in re-     and warming climate. This estimate however did not agree
sponse to climate oscillations and disturbance-induced emis-       with many carbon–climate models. The global soil respira-
sions, resulting in a land carbon sink of about 3.4 Pg C yr−1

Published by Copernicus Publications on behalf of the European Geosciences Union.
2                                                    H. Qiu et al.: Global and northern-high-latitude net ecosystem production

tion carbon flux has also been found to increase in the past         confidence in predictions of ESMs (Bradford et al., 2016;
several decades, according to the analysis of a global soil res-     Luo et al., 2016; Todd-Brown et al., 2013).
piration database, but the degree to which climate change af-           The Coupled Model Intercomparison Project (CMIP) co-
fects the changes in heterotrophic respiration is highly uncer-      ordinated a series of comprehensive comparisons among a
tain (Bond-Lamberty et al., 2018). Besides the scientific im-        handful of climate models and has become an essential ele-
portance of understanding the long-term feedbacks between            ment of international climate research (Eyring et al., 2016;
the terrestrial biosphere and the climate system, it is also crit-   Taylor et al., 2012). Building on the previous Atmospheric
ical to track the changes in the global land carbon budget for       Model Intercomparison Project (AMIP), CMIPs have broad-
making manageable climate mitigation policies as it is a key         ened its purposes and contributions to a wide range of disci-
component of the global carbon budget and has been consid-           plines to foster understanding of evolutions and changes in
ered to be an important approach to achieving carbon neu-            climate and its impacts on societal sectors from history, in
trality.                                                             the present and future (Eyring et al., 2016). Yet, great un-
   Particularly, as the host of most of the Earth’s permafrost       certainties were revealed from previous CMIPs’ results, and
soils, Arctic ecosystems store twice the amount of carbon as         the spread of the model responses to climate sensitivity re-
in the atmosphere and play an important role in the global           mains large (Collins et al., 2013). A primary scientific gap
carbon budget (Schuur et al., 2015; Tarnocai et al., 2009;           of previous CMIP experiments is how the radiative forcing
Zimov et al., 2006). During the last few decades, the tem-           pathways, resulting from anthropogenic activities or natu-
perature in northern-high-latitude (NHL; poleward of 50◦ N)          ral emissions, could be optimally estimated (Stouffer et al.,
regions has been rising particularly fast. The Arctic Circle         2017). More recently, the CMIP Phase 6 (CMIP6) employed
(66.5–90◦ N) has warmed more than 0.7 ◦ C per decade since           a number of the most updated global climate models and en-
1979, almost 4 times faster than the globe (Rantanen et al.,         dorsed 21 individually designed MIPs to address various sci-
2022). Previously stored soil carbon is potentially labialized       entific questions (Eyring et al., 2016). Guided by the goals
by permafrost thawing and enhanced decomposition of soil             to facilitate integrated research on the impact of future sce-
organic carbon due to a warmer climate (Belshe et al., 2012;         narios over natural and human systems and to help quantify
Koven et al., 2011; Natali et al., 2014; Schaefer et al., 2011;      uncertainties in future projections based on multi-model sim-
Schuur et al., 2015; Schuur and Abbott, 2011). This shapes a         ulations, the Scenario Model Intercomparison Project (Sce-
positive climate feedback since the excessive carbon release         narioMIP; O’Neill et al., 2016) incorporates a broad range
would in turn stimulate climate warming (Koven et al., 2011;         of future scenarios with various combinations of Represen-
Schuur and Abbott, 2011; Zimov et al., 2006). On the other           tative Concentration Pathways (RCPs) which were initially
hand, CO2 fertilization combined with other favorable con-           adopted in CMIP5 and newer Shared Socioeconomic Path-
ditions could enrich plant growth and drive the expansion of         ways (SSPs). These integrations allow a comprehensive as-
vegetation, e.g., Arctic tundra and boreal forest, in the Arctic     sessment of plausible future climate conditions covering a
region, which may enhance plant carbon uptake and photo-             wide span of mitigation and adaptation options (Riahi et al.,
synthesis productivity (Berner et al., 2020; Liang et al., 2018;     2017; van Vuuren et al., 2014) and represent the most up-
Mekonnen et al., 2019; Myers-Smith et al., 2020; Sistla et           dated understanding of climate change and the carbon cycle
al., 2013). Despite the prevailing greening signal observed in       in the next few decades (Eyring et al., 2016; O’Neill et al.,
the NHLs, regional browning or a negative normalized differ-         2016). The CMIP6 ScenarioMIP takes advantage of previous
ence vegetation index (NDVI) trend was also observed (Lara           CMIP resources and makes advancements in two major up-
et al., 2018; Phoenix and Bjerke, 2016). Disturbances such as        dates: first, the climate models employed are more updated,
fire are also increasing in frequency and duration in response       with better representations of underlying physical processes,
to the warming climate change and exerting impacts on vege-          and second, the models are driven by a new set of emis-
tation dynamics, including canopy structure and functioning,         sion pathways and land use scenarios, i.e., SSPs generated
which in turn affects photosynthesis and ecosystem respira-          by updated versions of integrated assessment models (IAMs)
tions (Hu et al., 2015; Mekonnen et al., 2019; Whitman et al.,       with new conceptual designs of future societal development
2018). These evolving and counteracting processes compli-            and evolution with different assumptions on the challenges
cate the determinations of whether the NHL ecosystem func-           to mitigation and adaptation to the climate change (O’Neill
tions as a carbon source or sink and how this will be projected      et al., 2016). The variety of SSP and RCP combinations also
in the future. Great uncertainties are revealed from evaluat-        covers a broader range of air pollutant emissions which are
ing results of multiple Earth system models (ESMs) in the            supposed to bridge the gap of relatively narrow aerosol sce-
NHL region, with some ESMs showing NHL ecosystems as                 narios adopted in CMIP5 (Stouffer et al., 2017).
a carbon sink and others indicating an opposite sign (Fisher            The goal of this study is thus to answer the following ques-
et al., 2014; Friedlingstein et al., 2014; Qian et al., 2010).       tions based on the CMIP6 ScenarioMIP results: (a) what is
Moreover, inconsistent model structure and diversified pro-          the future trajectory (spatial and temporal patterns) of global
cess representations as well as uncertainties in data, exter-        and NHL terrestrial carbon fluxes, in particular the net flux
nal variables, and parameterizations further compromise the          between the photosynthetic and respirational carbon fluxes,

Earth Syst. Dynam., 14, 1–16, 2023                                                        https://doi.org/10.5194/esd-14-1-2023

H. Qiu et al.: Global and northern-high-latitude net ecosystem production                                                         3

i.e., the net ecosystem productivity (NEP); (b) what is the rel-    and sea ice but differ in the horizontal resolution of land and
ative role of NHLs in global terrestrial ecosystem NEP; and         atmosphere and vary in some parameter settings in the atmo-
(c) what is the magnitude of the model uncertainties related        sphere component. The detailed information with land and
to the answers to the first two questions?                          atmosphere components and spatial resolutions, as well as
                                                                    key relevant model features, is listed in Table 1.
                                                                       We used monthly NEP, NPP, Rh, 2 m air temperature
2   Materials and methods                                           (TAS), and atmospheric CO2 concentration from the 10
                                                                    CMIP6 models over the historical period (1980–2014) and
We used NEP at both global and NHL (poleward of 50◦ N)              the four future scenarios (2015–2100) in our analyses. The
scales from existing CMIP6 outputs in this study. For di-           area-weighted sum of NEP, NPP, Rh, and NBP (net biosphere
agnosing purposes, we also analyzed the net primary pro-            productivity), as well as area-weighted mean of TAS from
ductivity (NPP) and heterotrophic respiration (Rh), since           different models and scenarios at global and NHL scales, was
they represent the two primary components of NEP: net               calculated. Non-land fractions of grid cells were excluded
plant carbon uptake and respirational carbon loss due to mi-        in the calculation. The bottom layer (i.e., the layer nearest
crobial decomposition, as NEP = NPP − Rh. These model               to the land surface) atmospheric CO2 concentration was ag-
outputs were obtained from the Earth System Grid Feder-             gregated into global and NHL scales, too. Note that only 4
ation (ESGF) (https://esgf-node.llnl.gov/search/cmip6/, ac-         out of the 10 models have available CO2 data to date. The
cessed on 1 October 2021), which unified the standardiza-           calculated monthly values from original outputs were fur-
tion to provide data access to various model outputs. Each          ther aggregated into the yearly scale for analysis. The annual
model in CMIP6 was conducted with an ensemble of sim-               model outputs with various spatial resolutions were resam-
ulations with different initial conditions, which were cate-        pled based on the model grids of BCC-CSM2-MR with a grid
gorized and labeled with four variant indices: the realiza-         resolution of around 1◦ (mesh size: 320×160) for generating
tion index (r), the initialization index (i), the physics index     the spatial trend maps. The ensemble model projections and
(p), and the forcing index (f ) (Eyring et al., 2016; Petrie        uncertainties in NEP, NPP, Rh, and TAS were evaluated by
et al., 2021). To uniformly control the model conditions in         calculating the multi-model mean (µ) and standard deviation
case of unexpected uncertainties, we confined the selection         (SD, σ ) of the yearly model outputs at both the global and
of model outputs to experiments with all variant indices la-        NHL scales. Meanwhile, the contribution of model SD rela-
beled with “1”, i.e., “r1i1p1f1”, for consistency. In particular,   tive to the mean is quantified by the coefficient of variation
the ScenarioMIP experiments endorsed a set of future global         (CV; CV = σ/µ) to interpret the relative model uncertainty.
change scenarios, i.e., the combinations of SSPs and RCPs,          We estimated the temporal trends of µ and SD using the lin-
to represent the alternative evolutions of societal develop-        ear least square regression method to quantitatively illustrate
ment, emissions, and concentrations (O’Neill et al., 2016).         the ensemble model behavior against time. Additionally, the
The RCPs are a set of four future greenhouse gas emission           sensitivity analyses were performed by calculating the rela-
pathways in which the end-of-century radiative forcing ap-          tive changes in carbon fluxes to their current levels (repre-
proaches four target levels (2.6, 4.5, 6.0, and 8.5 W m−2 ),        sented by the mean of 2010–2015) in response to the temper-
i.e., RCP2.6, RCP4.5, RCP3.7, and RCP8.5 (van Vuuren et             ature rises at an increment of 1 ◦ C (Pg C ◦ C−1 ) or atmosphere
al., 2011). The four target forcing levels are set to be re-        CO2 concentration at an increment of 1 ppm (Pg C ppm−1 )
alized by altering future greenhouse gas emissions and by           for each model at both the global and NHL scales. Finally,
changing underlying socioeconomic projections. The SSPs             we evaluated trends of the NHL carbon flux changes relative
were developed to describe a set of five future global socioe-      to the global carbon flux changes under the future scenar-
conomic development scenarios (SSP1 to SSP5). Four fu-              ios. The flux changes were calculated using the future annual
ture scenarios with different SSP and RCP combinations, in-         carbon fluxes minus the 2015 carbon flux.
cluding SSP1+RCP2.6 (SSP126), SSP2+RCP4.5 (SSP245),                    For the purpose of better understanding the uncertainties
SSP3+RCP7.0 (SSP370), and SSP5+RCP 8.5 (SSP585),                    in CMIP6 future projections, we used the land carbon budget
were considered in this study to cover a variety of future cli-     from the Global Carbon Project (GCP; Friedlingstein et al.,
mate change projections. Overall, 10 models were selected           2020) to benchmark the CMIP6 estimates in the historical
in this study, i.e., the ACCESS-ESM1-5 (Ziehn et al., 2020),        period (1980–2014), although this is not the main purpose of
BCC_CSM2-MR (Wu et al., 2019), CanESM5 (Swart et al.,               this study. Such comparison would be useful because it can
2019a), NorESM2-LM (Seland et al., 2020), NorESM2-MM                infer the potential biases in CMIP6 projections if we consider
(Seland et al., 2020), CESM2-WACCM (Gettelman et al.,               GCP data as the most reliable estimates of the historical car-
2019; Lawrence et al., 2019), CMCC-CM2-SR5 (Cherchi et              bon budget. However, only 7 out of the 10 CMIP6 models
al., 2019), EC-Earth3-Veg (Wyser et al., 2020), IPSL-CM6A-          output the NBP, which is the difference between NEP and
LR (Dufresne et al., 2013), and MPI-ESM1-2-LR (Maurit-              disturbance-induced carbon loss (e.g., fire emissions) and
sen et al., 2019; Reick et al., 2013). The NorESM2-LM and           land use change emissions. In addition, many models and
NorESM2-MM share the same horizontal resolution of ocean            GCP data do not provide the disturbance and land use change

https://doi.org/10.5194/esd-14-1-2023                                                       Earth Syst. Dynam., 14, 1–16, 2023
4                                                                    H. Qiu et al.: Global and northern-high-latitude net ecosystem production

Table 1. The CMIP6 models analyzed in this study, the model land and atmosphere components, spatial resolutions, and key relevant model
features are listed.

    Models                         Component models (longitude × latitude grids)
                           Atmosphere model               Land component model              Soil layers   N cycle    Number of plant   Dynamic      CO2
                                                                                                                     function types                 fertilization
                                                                                                                     (PFTs)            vegetation
                                                                                                                                                    effect
    ACCESS-ESM1-5          HadGAM2 (192 × 145)            CABLE2.4 (192 × 145)                       6    Yes        13                No           Yes
    BCC-CSM2-MR            BCC_AGCM3_MR                   BCC_AVIM2 (320 × 160)                     10    Yes        15                Yes          Yes
                           (320 × 160)
    CanESM5                CANAM5 (128 × 64)              CLASS3.6/CTEM1.2 (128 × 64)                3    No         9                 Yes          Yes
    NorESM2-LM∗            CAM-OSLO (144×96)              CLM5 (144 × 96)                           15    Yes        15 + crop PFTs    Yes          Yes
    NorESM2-MM∗            CAM-OSLO                       CLM5 (288 × 192)                          15    Yes        15 + crop PFTs    Yes          Yes
                           (288 × 192)
    CESM2-WACCM            WACCM6 (288 × 192)             CLM5 (288 × 192)                          15    Yes        15 + crop PFTs    Yes          Yes
    CMCC-CM2-SR5           CAM5.3 (288 × 192)             CLM4.5,        BGC        (bio-           15    Yes        15 + crop PFTs    No           Yes
                                                          geochemistry) mode (288 × 192)
    EC-Earth3-Veg          IFS cy36r4 (512 × 256)         HTESSEL (land surface scheme               2    Yes        11                Yes          Yes
                                                          built in IFS) and LPJ-GUESS v4
                                                          (512 × 256)
    IPSL-CM6A-LR           LMDZ (144 × 143)               ORCHIDEE v2.0, Water/Car-                 11    No         15                No           Yes
                                                          bon/Energy mode (144 × 143)
    MPI-ESM1-2-LR          ECHAM6.3 (192 × 96)            JSBACH3.20 (192 × 96)                      5    Yes        13                Yes          Yes

∗ The same models but run at different spatial resolutions.

emissions separately, making it challenging to conduct a de-                               Over the future years, the CMIP6 models generally sug-
tailed comparison between the two data sources at a detailed                            gest positive NEP over the global terrestrial ecosystems un-
level. Meanwhile, only global carbon budget was provided                                der all four scenarios (5.56 ± 0.88, 6.69 ± 0.78, 7.26 ± 0.98,
by GCP. Thus, we only compare NBP using the available                                   and 8.13 ± 1.56 Pg C yr−1 for SSP126, SSP245, SSP370,
data at the global scale.                                                               and SSP585, respectively, according to the mean of the 10
                                                                                        models). For NHLs, the NEP is estimated as 0.79 ± 0.59,
                                                                                        0.95 ± 0.14, 0.94 ± 0.16, and 1.01 ± 0.18 Pg C yr−1 for
                                                                                        SSP126, SSP245, SSP370, and SSP585, respectively. How-
3     Results
                                                                                        ever, a few models indeed suggest the global terrestrial
                                                                                        ecosystems with negative NEP at the end of the 21st cen-
3.1     Magnitudes of global and NHL NEP and NBP                                        tury under SSP126, such as CanESM5 and EC-Earth3-Veg.
                                                                                        In the NHLs, while most models suggest a positive NEP,
Figure 1 shows the annual NEP in the historical (1980–
                                                                                        BCC-CSM2-MR estimates a carbon source even though it
2014) and future (2015–2100) periods under the 4 global
                                                                                        shows the global ecosystem with a positive NEP, irrespective
change scenarios from the 10 CMIP6 models. On av-
                                                                                        of the model scenarios.
erage, the CMIP6 models indicate a strong global ter-
restrial ecosystem NEP of 4.48 ± 0.54 Pg C yr−1 (annual
mean ± interannual standard deviation) during the histori-                              3.2    Trends of global and NHL carbon fluxes in the 21st
cal period, with a large spread across individual models                                       century
(Fig. S1 in the Supplement). Meanwhile, the CMIP6 mod-
els suggest the global NBP of the seven available models                                Relative to the average condition in 2015–2020, the CMIP6
(Fig. S2) to be 0.99 ± 0.68 Pg C yr−1 . As a reference, the                             models on average suggest that the global mean TAS will
estimates from the GCP show the global terrestrial ecosys-                              increase by 1.16, 2.45, 4.05, and 5.25 ◦ C by the end of the
tems as a consistent carbon sink during the historical pe-                              21st century (2095–2100) under SSP126, SSP245, SSP370,
riod at 2.43 ± 0.97 Pg C yr−1 , which is about half as much                             and SSP585, respectively. The growth of TAS in NHLs is
as the model ensemble mean NEP but higher than the NBP                                  projected to increase by 2.36, 4.41, 7.08, and 9.36 ◦ C by
estimates. The models also estimate positive NHL NEPs as                                the end of this century under the four scenarios, respec-
0.56 ± 0.11 Pg C yr−1 during the historical period.                                     tively, which are exclusively higher than the global levels

Earth Syst. Dynam., 14, 1–16, 2023                                                                                  https://doi.org/10.5194/esd-14-1-2023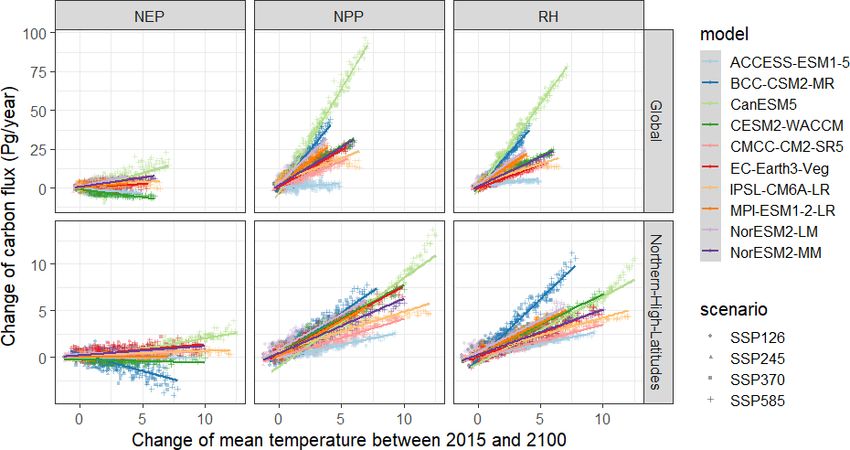
H. Qiu et al.: Global and northern-high-latitude net ecosystem production                                                            5

                                                                        normalized growth rates in the NHL NPP are 0.54, 1.37,
                                                                        2.03, and 2.63 g C yr−2 , respectively. Area-normalized global
                                                                        Rh growth rates are 0.59, 1.17, 1.72, and 2.15 g C yr−2 , while
                                                                        the area-normalized NHL Rh growth rates are 0.62, 1.20,
                                                                        1.84, and 2.41 g C yr−2 under the four scenarios, respectively.
                                                                        These results indicate that the average NPP and Rh grow
                                                                        faster in the NHLs than at the global scale. The fast-growing
                                                                        Rh cancels a large part of the NPP growth and resulted in
                                                                        slowly growing NEPs.
                                                                           CMIP6 models show a trend of NEP that first increases
                                                                        until the middle of the 21st century and then decreases at
                                                                        both NHL and global scales under SSP126. Overall, they
                                                                        show a slightly decreasing trend at NHL (−2.84 Tg C yr−2 )
                                                                        and global (−22.50 Tg C yr−2 ) scales during 2015–2100
                                                                        under SSP126. The trends are positive under SSP245 at
                                                                        8.93 Tg C yr−2 at the global scale and 2.54 Tg C yr−2 for
                                                                        NHLs. Under SSP370 and SSP585, the positive trends be-
                                                                        come more prominent: they are 20.08 and 44.40 Tg C yr−2
                                                                        at the global scale and 3.08 and 4.27 Tg C yr−2 in the NHL
                                                                        under SSP370 and SSP585, respectively.

                                                                        3.3   Divergent carbon flux estimations among the CMIP6
                                                                              models

                                                                        Large uncertainties in estimated global and NHL NEP were
                                                                        found, measured by the standard deviation (SD) across the
Figure 1. The annual mean and SD of NEP of the 10 CMIP6 mod-            CMIP6 models. The average SD for global NEP over the
els during the historical period (1980–2014) and the future period      historical period was 2.85 Pg C yr−1 , and it will expand to
(2015–2100) under four global change scenarios at the global (a)        3.96, 4.51, 5.44, and 5.60 Pg C yr−1 by the end of the 21st
and northern-high-latitude (NHL) (b) scales. The shaded area indi-      century under SSP126, SSP245, SSP370, and SSP585, re-
cates the SD values across the models. Error bars at the right of the
                                                                        spectively. Specifically, the model uncertainties in global and
panels show the mean SD of NEPs during 2095–2100 under each
                                                                        NHL NEP are preserved under SSP126, with small shrink-
of the four scenarios.
                                                                        ing trends of SD values (−2.84 and −0.22 Tg C yr−2 for
                                                                        global and NHL scales, respectively; Table 2). For SSP245,
                                                                        SSP370, and SSP585, the model uncertainties tend to expand
(Fig. S3 and Table 2). The atmospheric CO2 concentrations               towards the end of this century for both global and NHL
are projected to increase at similar rates during 2015–2100 at          scales. The model uncertainties are the largest under SSP370
global and NHL scales at 0.52, 2.36, 5.43, and 8.51 ppm yr−1            and SSP585. Globally, the mean NEP values for SSP370
under SSP126, SSP245, SSP370, and SSP585, respectively                  and SSP585 are 6.08 and 7.77 Pg C yr−1 , respectively, during
(Fig. S6).                                                              2095–2100, with concomitant large SDs of 7.84 Pg C yr−1
   In response to the elevating temperature, NPP and Rh                 (CV = 129 %) and 8.53 Pg C yr−1 (CV = 109.78 %). It is
from the CMIP6 models (Figs. S4 and S5) show positive                   worth noting that the mean NEP values for SSP370 and
trends under all four scenarios, and the trends are larger un-          SSP585 in NHLs are 0.77 and 0.84 Pg C yr−1 , respec-
der the warmer scenarios at both global and NHL scales.                 tively, during 2095–2100, while the SDs are relatively
Global NPP will increase at rates of 65.72, 196.48, 294.87,             large: 1.64 Pg C yr−1 (CV = 213.00 %) and 1.86 Pg C yr−1
and 387.75 Tg C yr−2 under SSP126, SSP245, SSP370, and                  (CV = 221.43 %) accordingly. Similarly, large uncertainties
SSP585, respectively. NHL NPP is projected to grow at rates             for NPP and Rh were identified. The average SDs for global
of 16.16, 41.33, 61.06, and 79.32 Tg C yr−2 accordingly. Ex-            and NHL NPP over the historical period were 14.89 and
cept SSP126, similarly positive but generally smaller trends            1.51 Pg C yr−1 , respectively, and they are projected to ex-
were found for Rh at global scales (Fig. S5, Table 2) with              pand at rates of 50.10, 138.01, 219.68, and 284.02 Tg C yr−1
rates of 87.15, 173.39, 254.43, and 318.31 Tg C yr−2 under              (global) and 4.64, 8.87, 18.07, and 26.87 Tg C yr−1 (NHLs)
the four scenarios. The NHL Rh trends are 18.64, 36.27,                 under SSP126, SSP245, SSP370, and SSP585, respectively.
55.39, and 72.56 Tg C yr−2 . Normalized by the area, the                For Rh, the global and NHL average SDs over the histori-
growth rates are 0.44, 1.33, 1.99, and 2.62 g C yr−2 for                cal period were 16.15 and 1.66 Pg C yr−1 , respectively, and
global NPP over the four scenarios, respectively. The area-             they are projected to expand at rates of 18.54, 36.27, 55.39,

https://doi.org/10.5194/esd-14-1-2023                                                          Earth Syst. Dynam., 14, 1–16, 2023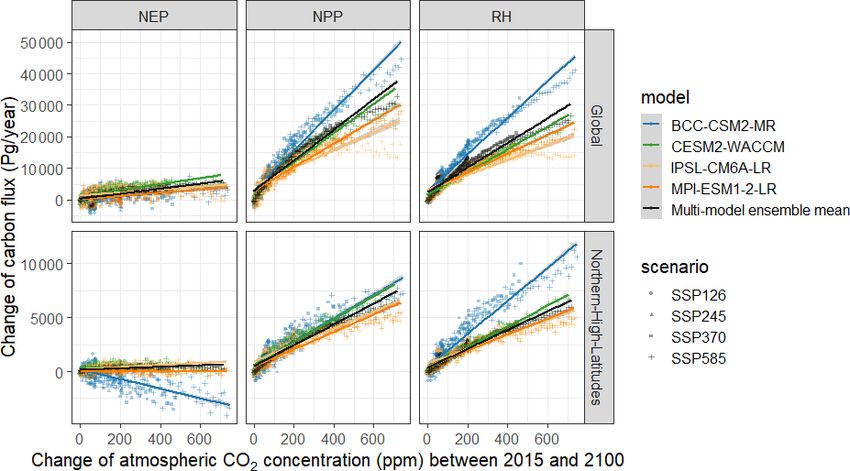
6                                                   H. Qiu et al.: Global and northern-high-latitude net ecosystem production

Table 2. Future trends and percent changes relative to 2010–2014 for the multi-model mean NEP, NPP, Rh, and TAS as well as their
uncertainties (SD across models) of the 10 CMIP6 models.

                                  Trends of ensemble model mean                     Trends of model uncertainty
                                      (Tg C yr−2 or ◦ C yr−1 ;                        (Tg C yr−2 or ◦ C yr−1 ;
                               percent change relative to 2010–2014)           percent change relative to 2010–2014)
             Scenarios      SSP126      SSP245     SSP370      SSP585         SSP126    SSP245      SSP370     SSP585
             Global NEP      −22.50        8.93       20.08      44.40         −2.84       22.98      35.03      51.75
                            (20.0 %)   (44.5 %)    (56.8 %)   (75.6 %)        (5.0 %)   (17.7 %)   (26.4 %)   (33.5 %)
             Global NPP        65.72     196.48      294.87     387.75          50.10     138.01     219.68     284.02
                             (9.7 %)   (15.9 %)    (20.5 %)   (24.5 %)       (23.5 %)   (38.7 %)   (53.1 %)   (63.5 %)
             Global Rh         87.15     173.39      254.43     318.31          68.59     136.77     197.18     228.03
                             (9.0 %)   (13.6 %)    (17.6 %)   (20.6 %)       (16.0 %)   (27.8 %)   (38.0 %)   (42.5 %)
             Global TAS        0.013      0.031      0.050       0.066         0.0027    0.0033      0.0043      0.0054
             NHL NEP          −2.43        2.54        3.08       4.27         −0.22        5.37      11.04      14.03
                            (22.8 %)   (53.5 %)    (52.4 %)   (62.9 %)       (−3.1 %)   (10.4 %)   (30.2 %)   (45.2 %)
             NHL NPP           16.16      41.33       61.06      79.32           4.64       8.87      18.07      26.87
                            (13.9 %)   (22.4 %)    (26.9 %)   (34.3 %)       (19.3 %)   (22.9 %)   (41.8 %)   (55.5 %)
             NHL Rh            18.54      36.27       55.39      72.56           4.06       7.76      16.63      23.52
                            (13.2 %)   (19.8 %)    (27.8 %)   (31.9 %)        (9.0 %)   (15.7 %)   (30.2 %)   (40.3 %)
             NHL TAS           0.026      0.057        0.09       0.12          0.015     0.019       0.017       0.017

and 72.56 Tg C yr−1 (global) and 4.06, 7.76, 16.63, and                The global NPP increases at a rate of 0.037 Pg C yr−1 per
23.52 Tg C yr−1 (NHLs) under SSP126, SSP245, SSP370,                   part per million CO2 concentration rise by IPSL-CM6A-
and SSP585, respectively.                                              LR to 0.064 Pg C yr−1 by BCC-CSM2-MR, and NHL NPP
   The large uncertainties in NEP are likely due to the un-            increases at a rate of 0.008 Pg C yr−1 by MPI-ESM1-2-LR
certain responses of NPP and Rh to the temperature changes             to 0.011 Pg C yr−1 by BCC-CSM2-MR. The global Rh in-
and CO2 fertilization effects in each model. The SDs of TAS            creases at a rate of 0.030 Pg C yr−1 per part per million CO2
projections by the end of the 21st century are 2.52, 2.79,             concentration rise by IPSL-CM6A-LR to 0.058 Pg C yr−1
2.68, and 2.71 ◦ C in the NHLs, which are much larger than             by BCC-CSM2-MR globally and from 0.007 Pg C yr−1 by
those of global TAS at 0.83, 0.84, 1.04, and 1.27 ◦ C, un-             IPSL-CM6A-LR to 0.015 Pg C yr−1 by BCC-CSM2-MR at
der SSP126, SSP245, SSP370, and SSP585, respectively. As               the NHL scale. The NEP shows contrasting trends at the two
shown in Fig. 2, the CMIP6-estimated annual carbon fluxes              different spatial scales relative to the CO2 concentration rise
have strong linear relationships to TAS. For NPP, a 1 ◦ C in-          by BCC-CSM2-MR: at the global scale, NEP is positively
crease in global TAS corresponds to an increase in global              correlated with CO2 concentration, while at the NHL scale
annual NPP from 0.47 to 13.34 Pg C yr−1 ; in the NHLs, the             they are negatively correlated. The other three models show
range spans from 0.28 to 0.95 Pg C yr−1 . Global annual Rh             slightly positive trends of NEP fluxes relative to the CO2 con-
will increase at rates from 1.06 to 11.12 Pg C per 1 ◦ C in-           centration rise at both scales. There remains a strong linear
crease in global TAS, and the rates are between 0.28 and               relationship between TAS and atmospheric CO2 concentra-
1.29 Pg C yr−1 for the NHL annual Rh. All the lowest sensi-            tions irrespective of the model scenarios (Fig. S7), which
tivities are estimated by ACCESS-ESM-1-5, and the highest              could explain the similar trend patterns of carbon flux change
sensitivities are from CanESM5. As the residual of NPP and             in response to the TAS and CO2 concentration rise in Figs. 2
Rh, the sensitivities of NEP to TAS are more complicated:              and 3.
the global annual NEP will change at a rate between −0.59
(by ACCESS-ESM-1-5) and 2.21 Pg C yr−1 (by CanESM5)                    3.4    Latitudinal distributions of NEP
per 1 ◦ C increase in global TAS, and the changing rates are
between −0.37 (by BCC-CSM2-MR) and 0.23 Pg C yr−1 (by                  Figure 4 shows average NEP in the 10◦ latitudinal bins be-
CanESM5) for the NHL annual NEP. The carbon fluxes vs.                 tween 60◦ S and 90◦ N in the historical, the early (2015–
CO2 concentration and carbon fluxes vs. temperature rise               2024), the middle (2050–2059), and the end (2091–2100)
demonstrate similar linear relationships, as shown in Fig. 3.          decades of the 21st century under the four scenarios. Over-
                                                                       all, the global ecosystems are projected as a stronger car-

Earth Syst. Dynam., 14, 1–16, 2023                                                           https://doi.org/10.5194/esd-14-1-2023
H. Qiu et al.: Global and northern-high-latitude net ecosystem production 7
Figure 2. Sensitivity of carbon flux changes in response to the TAS changes (relative to the 2015 values) at global and NHL scales for each
CMIP6 model under the four future scenarios.
Figure 3. Sensitivity of carbon flux changes in response to the CO2 concentration changes (relative to the 2015 values) at global and NHL
scales for each CMIP6 model under the four future scenarios. Only available data from four CMIP6 models were used for producing this
figure.
bon sink under SSP245, SSP370, and SSP585 than the his- 80.46 %, and 54.58 % for the four future scenarios, accord-
torical period for most of the latitudes except the polar re- ingly.
gion (> 80◦ N), where the NEP remains relatively constant.
Under SSP126, there is a drawdown during 2091–2100 be-
tween 20◦ S and 10◦ N. Among all the latitudinal bins, the 3.5 Spatial pattern of trends of NHL carbon fluxes
tropical regions near the Equator act as the largest carbon
sink with the highest uncertainties. However, the uncertain- According to the average of CMIP6 models, Fig. 5 shows
ties at 60 and 70◦ N are exclusively larger relative to the significant positive trends of NPP and Rh but mixed trends of
absolute values of NEP in this region (i.e., the CV values), NEP in the NHLs under all of the four scenarios. With grow-
which are 109.44 % and 264.11 % under SSP126, 86.37 % ing radiative forcing or temperature from SSP126 to SSP585,
and 173.89 % under SSP245, 106.92 % and 364.27 % under the positive trends of NPP and Rh increase everywhere in the
SSP370, and 119.60 % and 484.50 % under SSP585, com- NHLs. The spatial pattern of NEP trends is more compli-
pared with those near the Equator of 100.32 %, 58.94 %, cated. Under SSP126, most of the forested area in the NHLs
are projected to have significantly decreasing NEP, while the
other regions show no significant trends. More area starts
https://doi.org/10.5194/esd-14-1-2023 Earth Syst. Dynam., 14, 1–16, 20238 H. Qiu et al.: Global and northern-high-latitude net ecosystem production
Figure 4. Latitudinal distributions of NEP in the historical period and under different future scenarios. The gray lines with bands are the
historical multi-model mean and uncertainties in NEP. The boxplots are the future NEP distributed in each 10◦ bin between 60◦ S and
90◦ N under (a) SSP126, (b) SSP245, (c) SSP370, and (d) SSP585, during the early (2015–2024), the middle (2050–2059), and the end
(2091–2100) decades of the 21st century.
to have significantly positive and larger NEP trends from with lower radiative forcing levels but become high for NEP
SSP126 to SSP245 and SSP370 in response to larger radia- under high-radiative-forcing scenarios. For instance, the un-
tive forcing levels. Under SSP585, which shows the highest certainties could be as high as 5 times the contribution esti-
level of radiative forcing and global warming, most of the mated by the multi-model means for NEP under SSP370 and
NHL NEP, particularly areas covered by forest, is projected SSP585.
to have significant positive trends, while the NEP in the tun-
dra area of northern Canada and Siberia in contrast has sig-
nificant negative trends. 4 Discussion
In this analysis, we present the quantification of the future
3.6 The role of NHLs in future global carbon flux magnitudes, trends, patterns, and uncertainties in terrestrial
changes ecosystem carbon fluxes from an ensemble of 10 CMIP6
models, with a particular focus on the Arctic–boreal regions
The CMIP6 models show a consistent positive contribution in the northern high latitudes. The CMIP6 models estimate
of the NHLs to the global carbon flux changes since 2015, the global terrestrial ecosystems as a strong carbon sink
measured by slopes of linear regression models between the but with a magnitude that is 2.06 Pg yr−1 , or 85 % higher
NHL and global numbers (Fig. 6). On average, the CMIP6 than the estimates from the benchmarking global carbon
models estimate that NHLs contribute 16 % of global NPP project, suggesting consideration of bias corrections when
increase under SSP126 and 20 % under the other three sce- using CMIP6 modeled carbon fluxes for other applications,
narios and contribute 23 %–26 % of global Rh increase under particularly those sensitive to the magnitude of these carbon
the four scenarios. For NEP, the NHLs’ contributions are be- fluxes.
tween 7 % and 11 %. However, it is worth noting that some On average, the CMIP6 models project large increases in
of these contributions are with high uncertainties from dif- NPP and Rh in the global and NHL terrestrial ecosystems in
ferent models. For example, CanESM5 generally projects the the future, while the NHLs are projected to grow 1.43, 1.13,
largest increases in global and NHL NPP and Rh but stands 1.31, and 1.40 times faster for NPP and 1.47, 1.46, 1.58, and
out to suggest the lowest NHL contribution (i.e., the smallest 1.55 times faster for Rh under SSP126, SSP245, SSP370, and
slopes) to global NPP and Rh. The uncertainties (measured SSP585 than those at the global scale (Table 2). This is be-
by the standard deviation of the slopes estimated by the 10 cause of the faster increase in temperature, larger CO2 fertil-
models) are relatively lower for NPP and Rh and scenarios ization effect, and higher sensitivities to the warming climate
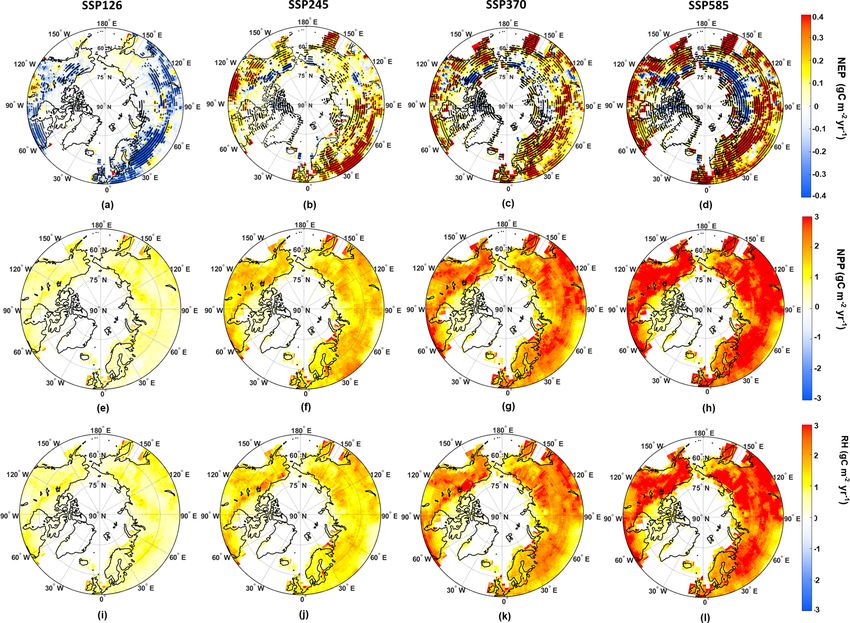
Earth Syst. Dynam., 14, 1–16, 2023 https://doi.org/10.5194/esd-14-1-2023H. Qiu et al.: Global and northern-high-latitude net ecosystem production 9 Figure 5. The spatial distributions of the trends of NHL carbon fluxes under different future scenarios. The rows of the panels are NEP, NPP, and Rh from top to bottom, and the columns of the panels are SSP126, SSP245, SSP370, and SSP585 from left to right. The unit is grams of carbon per square meter per year. The black dots on the NEP maps denote significance of the regression values (p < 0.05) when fitting the carbon flux trends within each grid. Most of the model grids show significance of the regression for NPP and Rh and are not shown on the maps. (Fig. 2) in the NHLs. Such concurrently rising NPP and Rh The second reason could be the more abundant availabil- were widely evidenced and discussed in previous literature. ity of substrates for metabolism from accelerated ecosystem Jeong et al. (2018) showed that long-term measurements of carbon uptake and debris production (Bond-Lamberty et al., CO2 revealed increasing carbon cycling rates and decreas- 2018). ing soil carbon residence time in the Arctic. On one hand, The terrestrial ecosystem carbon cycle is complex, and greening of the world was widely identified due to more fa- many past and ongoing ecological studies sought to under- vorable vegetation growth conditions promoted by a warm- stand the underlying mechanisms. Long-term measurements ing climate (Piao et al., 2020; Zhu et al., 2016), and warmer at FLUXNET sites have evidenced greater bioavailable car- temperature and CO2 fertilization were revealed to enhance bon stock due to the faster increasing gross primary pro- the terrestrial gross primary production in the NHLs (Liang duction than the concurrent rises in ecosystem respiration et al., 2018; Myers-Smith et al., 2020; Wenzel et al., 2016). in response to climate change (Falge et al., 2002). How- On the other hand, the increases in Rh in response to tem- ever, contradictory conclusions were drawn in some regions perature rise could be attributed to two major reasons (Bond- of the world where reduced soil carbon stocks were found Lamberty et al., 2018). One reason for the rising Rh could due to more carbon efflux than influx (Naidu and Bagchi, result from more active soil bacteria metabolism, and thus 2021). The case of the NHLs is even more special, partly enhanced soil organic matter (SOM) mineralization due to because the biological processes such as the vegetation phe- rising temperature (Crowther et al., 2016; Lu et al., 2013). nology and soil decomposition are especially sensitive to cli- https://doi.org/10.5194/esd-14-1-2023 Earth Syst. Dynam., 14, 1–16, 2023
10                                                   H. Qiu et al.: Global and northern-high-latitude net ecosystem production

Figure 6. Changes in NHL carbon fluxes relative to the changes in global carbon fluxes, as indicated by the 10 CMIP6 models.

mate change due to the extremely cold environment and the             carbon sink, and tundra-dominated area is likely becoming a
relatively faster temperature change rates (McGuire et al.,           stronger carbon source (Fig. 4).
2009; Richardson et al., 2018). The thawing of permafrost                Yet, it is important to note that there remain large uncer-
is changing the soil water balance and increasing the thick-          tainties in the magnitudes and trends of the carbon balance
ness of the active layer, which renders the ancient carbon un-        in the global and NHL terrestrial ecosystems. The underly-
der potential decomposition (Belshe et al., 2012; Schuur et           ing carbon cycling processes are difficult to quantify and are
al., 2015; Schuur and Abbott, 2011). Moreover, the terres-            poorly constrained in current ESMs (Bradford et al., 2016).
trial carbon fluxes are influenced by the evolutions of various       Sensitivities of carbon fluxes in ESMs are divergent in re-
other climate factors, such as precipitation, soil moisture, and      sponses to different climate change drivers (e.g., Figs. 2 and
atmospheric nitrogen deposition (Naidu and Bagchi, 2021;              3), such that model uncertainties are pronounced in various
Sierra et al., 2015; Yue et al., 2017). Besides the disturbance-      aspects (Bradford et al., 2016). Although different land sur-
induced carbon loss, the carbon balance in the terrestrial            face models share similar carbon flux transfer mechanisms
ecosystems will be determined by the difference between               among different carbon pools, they are diversified in the pool
rising primary productivity and the accelerated soil carbon           structures (Shao et al., 2013; Yan et al., 2014) and param-
decomposition driven by the interplay of multiple climate             eterizations (Luo and Schuur, 2020). For example, CMIP6
drivers (McKane et al., 1997; Sistla et al., 2013). These             models were found to inaccurately estimate leaf area index
complex processes have been reflected in the results of our           (LAI), an essential biophysical variable that drives the car-
CMIP6 analysis. As the residual between the carbon influx             bon cycle and many other ecological processes (Song et al.,
(NPP) and efflux (Rh), global and NHL NEP are projected               2021). Song et al. (2021) suggested that most CMIP6 mod-
to have more complicated changing patterns. The global and            els were not able to correctly reproduce the magnitudes of
NHL NEP are growingly positive in the future, but at lower            short- to long-term temporal variability in LAI, although they
rates than NPP and Rh. While global NEP is generally higher           showed improvement in estimating seasonal LAI variations
under warmer scenarios, NHL NEP will be at similar levels             compared with CMIP5 models. Moreover, they revealed that
by the end of the 21st century under different warming levels         most of the CMIP6 models overestimated the LAI in non-
(e.g., SSP245, SSP370, SSP585; Fig. 1). This is partially due         forested vegetation areas against observations, which largely
to the varying response of different ecosystems to the warm-          contributed to the general overestimation of the global mean
ing climate, as forest-dominated area is becoming a larger            LAI. While it is hard to distinguish how the improvements

Earth Syst. Dynam., 14, 1–16, 2023                                                           https://doi.org/10.5194/esd-14-1-2023
H. Qiu et al.: Global and northern-high-latitude net ecosystem production                                                          11

of LAI estimation in CMIP6 models might contribute to              of the land use impacts in different CMIP6 models (Ito et al.,
their performance in estimating carbon fluxes, their physi-        2020). All the CMIP6 model results presented in this analy-
cal linkages are clear. Any underestimation of LAI usually         sis do predict rising NPP and Rh in response to temperature
leads to lower NPP estimations and possibly higher Rh due          rise in the future, but with divergent trends and patterns. Con-
to the lower LAI-induced cooling effects on the soil and           sequently, large uncertain or even irreconcilable NEP results
therefore may result in lower NEP. Better seasonal variation       in the NHLs are shown among different models.
in LAI may indicate better capture of the growing season
length of vegetation and the annual carbon budget (Piao et         5   Conclusion
al., 2019). In addition, the categorizations of plant functional
types (PFTs) are also different among the 10 ESMs (Ta-             The Climate Model Intercomparison Project is a major ap-
ble 1); for example, CanESM5 has 9 PFTs, while CESM2-              proach to quantifying and understanding the future terres-
WACCM has 15 PFTs plus additional crop types. Most mod-            trial ecosystem carbon cycle and its interactions with the cli-
els have the nitrogen cycles coupled with carbon cycles with       mate system. In this study, we present the trends and pat-
the exception of CanESM5 and IPSL-CM6A-LR (Table 1).               terns of future projections of carbon fluxes (particularly the
For compensating the effects of nutrient limitation, IPSL-         net ecosystem productivity) in the global and northern-high-
CM6A-LR adopts the downregulation function to limit the            latitude ecosystems from a set of the most up-to-date CMIP6
maximum photosynthesis rates to account for nutrient lim-          models. Based on the average of the CMIP6 models, our
itations (Boucher et al., 2020), while the CanESM5 has no          analysis showed that global and NHL ecosystems were and
nutrient limitations accounted for (Swart et al., 2019a). This     would continue to be carbon sinks, although large uncertain-
could be one of the reasons CanESM5 has the largest sensi-         ties were found for the size and trends of the carbon sinks
tivities of NPP and Rh fluxes in response to climate change        among different CMIP6 models, which are not obviously
(Fig. 2). Comprehensive and standard validations of multiple       attenuated compared with previous model intercomparison
variables are needed to assess the model performance and           project results. Although the warming levels and sensitiv-
uncertainties in biogeochemical simulations across CMIP6           ity of ecosystems to the warming temperature are higher in
models (Spafford and MacDougall, 2021).                            the NHLs, the contribution of NHLs to the global NEP in-
   In our analysis, the uncertainties in the carbon fluxes         crease is small, however with larger relative uncertainties.
across the CMIP6 models tend to increase over time, and            The model uncertainties are pronounced in the historical sim-
they grow faster under warmer scenarios. The NHL NEP               ulations and are projected to expand more widely in the
has more relative uncertainties as opposed to the mean com-        future under scenarios with larger radiative forcing levels.
pared with global NEP, and this difference is more pro-            These results revealed the emergent necessity to make en-
nounced in scenarios with higher radiative forcing levels.         deavors to bridge the knowledge gaps between process pa-
By 2100, the CMIP6 models suggest the NHLs to be a                 rameterization and representations of various ESMs and the
carbon sink of 0.54 ± 0.77, 1.01 ± 0.98, 0.97 ± 1.62, and          real-world processes, as well as to deepen the understand-
1.05 ± 1.83 Pg C yr−1 under SSP126, SSP245, SSP370, and            ing of the underlying mechanisms of the feedforward and
SSP585, respectively, which are exclusively larger than the        feedback roles of the NHL ecosystem in response to climate
previous C4MIP results under the IPCC SRES A2 scenario             change.
with a temperature rise of approximately 3.4 (2.0–5.4) ◦ C by
2100 (0.3 ± 0.3 Pg C yr−1 ; Qian et al., 2010). The relative un-
certainties (SD, mean) for the four scenarios are 143.59 %,        Code and data availability. The          CMIP6      model       re-
97.03 %, 167.01 %, and 174.29 %, which are at levels sim-          sults are publicly available on the ESGF website:
ilar to or larger than the C4MIP results (100 %), indicat-         https://doi.org/10.22033/ESGF/CMIP6.4320, Ziehn et al., 2019;
ing the uncertainty level is not reduced in the new models.        https://doi.org/10.22033/ESGF/CMIP6.3028, Xin et al., 2019;
Moreover, models show distinct sensitivities of carbon fluxes      https://doi.org/10.22033/ESGF/CMIP6.3683, Swart et al., 2019b;
in response to the future temperature rise. While NPP and          https://doi.org/10.22033/ESGF/CMIP6.8248, Seland et al., 2019;
                                                                   https://doi.org/10.22033/ESGF/CMIP6.8250, Bentsen et al., 2019;
Rh show a uniformly positive response to temperature rise,
                                                                   https://doi.org/10.22033/ESGF/CMIP6.10100, Danabasoglu, 2019;
NEP changes could be either positive or negative for differ-
                                                                   https://doi.org/10.22033/ESGF/CMIP6.3887, Lovato and Peano,
ent models. The uncertainties in soil carbon dynamics and          2020; https://doi.org/10.22033/ESGF/CMIP6.4876, EC-Earth
various projections of soil carbon stock and changes in dif-       Consortium, 2019; https://doi.org/10.22033/ESGF/CMIP6.5262,
ferent CMIP5 models were broadly evaluated and discussed           Boucher et al., 2019; https://doi.org/10.22033/ESGF/CMIP6.6690,
in previous studies (Friedlingstein et al., 2014; Todd-Brown       Wieners et al., 2019;
et al., 2013, 2014; Yan et al., 2014). Recent evaluations of          The codes for processing the data and generating the figures are
soil carbon stock and sequestration of CMIP6-LUMIP mod-            available at https://github.com/qhgogogo/CMIP6-carbonflux (last
els also showed large differences among different CMIP6            access: 17 May 2021; https://doi.org/10.5281/zenodo.4768532,
models, which in another way indicates the possible uncer-         Qiu, 2021).
tainties in soil carbon dynamics stemming from simulation

https://doi.org/10.5194/esd-14-1-2023                                                       Earth Syst. Dynam., 14, 1–16, 2023
12 H. Qiu et al.: Global and northern-high-latitude net ecosystem production
Supplement. The supplement related to this article is available CMIP6 ScenarioMIP, Earth System Grid Federation [data set],
online at: https://doi.org/10.5194/esd-14-1-2023-supplement. https://doi.org/10.22033/ESGF/CMIP6.8250, 2019.
Bond-Lamberty, B., Bailey, V. L., Chen, M., Gough, C. M., and Var-
gas, R.: Globally rising soil heterotrophic respiration over recent
Author contributions. HQ and MC designed the study, pro- decades, Nature, 560, 80–83, https://doi.org/10.1038/s41586-
cessed the data, and prepared the original manuscript. DH, YZ, and 018-0358-x, 2018.
XZ contributed subsequent analysis and helped write and edit the Boucher, O., Denvil, S., Levavasseur, G., Cozic, A., Caubel,
manuscript. A., Foujols, M.-A., Meurdesoif, Y., Cadule, P., Devilliers, M.,
Dupont, E., and Lurton, T.: IPSL IPSL-CM6A-LR model output
prepared for CMIP6 ScenarioMIP, Earth System Grid Federation
Competing interests. The contact author has declared that none [data set], https://doi.org/10.22033/ESGF/CMIP6.5262, 2019.
of the authors has any competing interests. Boucher, O., Servonnat, J., Albright, A. L., Aumont, O., Balkan-
ski, Y., Bastrikov, V., Bekki, S., Bonnet, R., Bony, S., Bopp, L.,
Braconnot, P., Brockmann, P., Cadule, P., Caubel, A., Cheruy,
F., Codron, F., Cozic, A., Cugnet, D., D’Andrea, F., Davini,
Disclaimer. Publisher’s note: Copernicus Publications remains
P., Lavergne, C. de, Denvil, S., Deshayes, J., Devilliers, M.,
neutral with regard to jurisdictional claims in published maps and
Ducharne, A., Dufresne, J.-L., Dupont, E., Éthé, C., Fairhead, L.,
institutional affiliations.
Falletti, L., Flavoni, S., Foujols, M.-A., Gardoll, S., Gastineau,
G., Ghattas, J., Grandpeix, J.-Y., Guenet, B., Guez, L., E.,
Guilyardi, E., Guimberteau, M., Hauglustaine, D., Hourdin, F.,
Acknowledgements. We acknowledge the World Climate Re- Idelkadi, A., Joussaume, S., Kageyama, M., Khodri, M., Krin-
search Programme, which, through its Working Group on Coupled ner, G., Lebas, N., Levavasseur, G., Lévy, C., Li, L., Lott, F.,
Modelling, coordinated and promoted CMIP6. We thank the climate Lurton, T., Luyssaert, S., Madec, G., Madeleine, J.-B., Maig-
modeling groups for producing and making available their model nan, F., Marchand, M., Marti, O., Mellul, L., Meurdesoif, Y.,
output, the Earth System Grid Federation (ESGF) for archiving the Mignot, J., Musat, I., Ottlé, C., Peylin, P., Planton, Y., Polcher,
data and providing access, and the multiple funding agencies who J., Rio, C., Rochetin, N., Rousset, C., Sepulchre, P., Sima,
support CMIP6 and ESGF, as well as the efforts of all involved mod- A., Swingedouw, D., Thiéblemont, R., Traore, A. K., Van-
eling centers. coppenolle, M., Vial, J., Vialard, J., Viovy, N., and Vuichard,
N.: Presentation and Evaluation of the IPSL-CM6A-LR Cli-
mate Model, J. Adv. Model. Earth Sy., 12, e2019MS002010,
Financial support. This research has been supported by https://doi.org/10.1029/2019MS002010, 2020.
the National Aeronautics and Space Administration (grant Bradford, M. A., Wieder, W. R., Bonan, G. B., Fierer, N., Raymond,
no. NNH18ZDA001N, award no. 80HQTR19T0055). P. A., and Crowther, T. W.: Managing uncertainty in soil carbon
feedbacks to climate change, Nat. Clim. Change, 6, 751–758,
https://doi.org/10.1038/nclimate3071, 2016.
Review statement. This paper was edited by Anping Chen and Campbell, J. E., Berry, J. A., Seibt, U., Smith, S. J., Montzka, S. A.,
reviewed by Xu Lian and one anonymous referee. Launois, T., Belviso, S., Bopp, L., and Laine, M.: Large histori-
cal growth in global terrestrial gross primary production, Nature,
544, 84–87, https://doi.org/10.1038/nature22030, 2017.
Cherchi, A., Fogli, P. G., Lovato, T., Peano, D., Iovino, D., Gualdi,
S., Masina, S., Scoccimarro, E., Materia, S., Bellucci, A., and
References Navarra, A.: Global Mean Climate and Main Patterns of Vari-
ability in the CMCC-CM2 Coupled Model, J. Adv. Model. Earth
Belshe, E. F., Schuur, E. A. G., Bolker, B. M., and Bracho, R.: Sy., 11, 185–209, https://doi.org/10.1029/2018MS001369, 2019.
Incorporating spatial heterogeneity created by permafrost thaw Collins, M., Knutti, R., Gutowski, W., Brooks, H., Shindell, D.,
into a landscape carbon estimate, J. Geophys. Res.-Biogeo., 117, and Webb, R.: Long-term Climate Change: Projections, Commit-
G01026, https://doi.org/10.1029/2011JG001836, 2012. ments and Irreversibility, Geological and Atmospheric Sciences
Berner, L. T., Massey, R., Jantz, P., Forbes, B. C., Macias-Fauria, Reports, in: Climate change 2013-The physical science basis:
M., Myers-Smith, I., Kumpula, T., Gauthier, G., Andreu-Hayles, Contribution of working group I to the fifth assessment report
L., Gaglioti, B. V., Burns, P., Zetterberg, P., D’Arrigo, R., and of the intergovernmental panel on climate change, Cambridge
Goetz, S. J.: Summer warming explains widespread but not uni- University Press, 1029–1136, ISBN 9781107057991, 2013.
form greening in the Arctic tundra biome, Nat. Commun., 11, Crowther, T. W., Todd-Brown, K. E. O., Rowe, C. W., Wieder, W.
4621, https://doi.org/10.1038/s41467-020-18479-5, 2020. R., Carey, J. C., Machmuller, M. B., Snoek, B. L., Fang, S., Zhou,
Bentsen, M., Oliviè, D. J. L., Seland, Ø., Toniazzo, T., Gjermund- G., Allison, S. D., Blair, J. M., Bridgham, S. D., Burton, A. J.,
sen, A., Graff, L. S., Debernard, J. B., Gupta, A. K., He, Y., Carrillo, Y., Reich, P. B., Clark, J. S., Classen, A. T., Dijkstra, F.
Kirkevåg, A., Schwinger, J., Tjiputra, J., Aas, K. S., Bethke, I., A., Elberling, B., Emmett, B. A., Estiarte, M., Frey, S. D., Guo,
Fan, Y., Griesfeller, J., Grini, A., Guo, C., Ilicak, M., Karset, I. J., Harte, J., Jiang, L., Johnson, B. R., Kröel-Dulay, G., Larsen,
H. H., Landgren, O. A., Liakka, J., Moseid, K. O., Nummelin, K. S., Laudon, H., Lavallee, J. M., Luo, Y., Lupascu, M., Ma, L.
A., Spensberger, C., Tang, H., Zhang, Z., Heinze, C., Iversen, T., N., Marhan, S., Michelsen, A., Mohan, J., Niu, S., Pendall, E.,
and Schulz, M.: NCC NorESM2-MM model output prepared for
Earth Syst. Dynam., 14, 1–16, 2023 https://doi.org/10.5194/esd-14-1-2023H. Qiu et al.: Global and northern-high-latitude net ecosystem production 13 Peñuelas, J., Pfeifer-Meister, L., Poll, C., Reinsch, S., Reynolds, S., Le Quéré, C., Canadell, J. G., Ciais, P., Jackson, R. B., Alin, L. L., Schmidt, I. K., Sistla, S., Sokol, N. W., Templer, P. H., S., Aragão, L. E. O. C., Arneth, A., Arora, V., Bates, N. R., Treseder, K. K., Welker, J. M., and Bradford, M. A.: Quantifying Becker, M., Benoit-Cattin, A., Bittig, H. C., Bopp, L., Bultan, global soil carbon losses in response to warming, Nature, 540, S., Chandra, N., Chevallier, F., Chini, L. P., Evans, W., Florentie, 104–108, https://doi.org/10.1038/nature20150, 2016. L., Forster, P. M., Gasser, T., Gehlen, M., Gilfillan, D., Gkritza- Danabasoglu, G.: NCAR CESM2-WACCM model output prepared lis, T., Gregor, L., Gruber, N., Harris, I., Hartung, K., Haverd, V., for CMIP6 ScenarioMIP, Earth System Grid Federation [data Houghton, R. A., Ilyina, T., Jain, A. K., Joetzjer, E., Kadono, K., set], https://doi.org/10.22033/ESGF/CMIP6.10100, 2019. Kato, E., Kitidis, V., Korsbakken, J. I., Landschützer, P., Lefèvre, Dufresne, J.-L., Foujols, M.-A., Denvil, S., Caubel, A., Marti, O., N., Lenton, A., Lienert, S., Liu, Z., Lombardozzi, D., Marland, Aumont, O., Balkanski, Y., Bekki, S., Bellenger, H., Benshila, G., Metzl, N., Munro, D. R., Nabel, J. E. M. S., Nakaoka, S.-I., R., Bony, S., Bopp, L., Braconnot, P., Brockmann, P., Cadule, Niwa, Y., O’Brien, K., Ono, T., Palmer, P. I., Pierrot, D., Poul- P., Cheruy, F., Codron, F., Cozic, A., Cugnet, D., de Noblet, ter, B., Resplandy, L., Robertson, E., Rödenbeck, C., Schwinger, N., Duvel, J.-P., Ethé, C., Fairhead, L., Fichefet, T., Flavoni, J., Séférian, R., Skjelvan, I., Smith, A. J. P., Sutton, A. J., Tan- S., Friedlingstein, P., Grandpeix, J.-Y., Guez, L., Guilyardi, E., hua, T., Tans, P. P., Tian, H., Tilbrook, B., van der Werf, G., Hauglustaine, D., Hourdin, F., Idelkadi, A., Ghattas, J., Jous- Vuichard, N., Walker, A. P., Wanninkhof, R., Watson, A. J., saume, S., Kageyama, M., Krinner, G., Labetoulle, S., Lahel- Willis, D., Wiltshire, A. J., Yuan, W., Yue, X., and Zaehle, S.: lec, A., Lefebvre, M.-P., Lefevre, F., Levy, C., Li, Z. X., Lloyd, Global Carbon Budget 2020, Earth Syst. Sci. Data, 12, 3269– J., Lott, F., Madec, G., Mancip, M., Marchand, M., Masson, S., 3340, https://doi.org/10.5194/essd-12-3269-2020, 2020. Meurdesoif, Y., Mignot, J., Musat, I., Parouty, S., Polcher, J., Rio, Gettelman, A., Mills, M. J., Kinnison, D. E., Garcia, R. R., C., Schulz, M., Swingedouw, D., Szopa, S., Talandier, C., Terray, Smith, A. K., Marsh, D. R., Tilmes, S., Vitt, F., Bardeen, P., Viovy, N., and Vuichard, N.: Climate change projections us- C. G., McInerny, J., Liu, H.-L., Solomon, S. C., Polvani, L. ing the IPSL-CM5 Earth System Model: from CMIP3 to CMIP5, M., Emmons, L. K., Lamarque, J.-F., Richter, J. H., Glanville, Clim. Dynam., 40, 2123–2165, https://doi.org/10.1007/s00382- A. S., Bacmeister, J. T., Phillips, A. S., Neale, R. B., Simp- 012-1636-1, 2013. son, I. R., DuVivier, A. K., Hodzic, A., and Randel, W. J.: EC-Earth Consortium (EC-Earth): EC-Earth-Consortium The Whole Atmosphere Community Climate Model Version EC-Earth3-Veg model output prepared for CMIP6 Sce- 6 (WACCM6), J. Geophys. Res.-Atmos., 124, 12380–12403, narioMIP, Earth System Grid Federation [data set], https://doi.org/10.1029/2019JD030943, 2019. https://doi.org/10.22033/ESGF/CMIP6.4876, 2019. Hu, F. S., Higuera, P. E., Duffy, P., Chipman, M. L., Rocha, Eyring, V., Bony, S., Meehl, G. A., Senior, C. A., Stevens, B., A. V., Young, A. M., Kelly, R., and Dietze, M. C.: Arc- Stouffer, R. J., and Taylor, K. E.: Overview of the Coupled tic tundra fires: natural variability and responses to climate Model Intercomparison Project Phase 6 (CMIP6) experimen- change, Frontiers in Ecology and the Environment, 13, 369–377, tal design and organization, Geosci. Model Dev., 9, 1937–1958, https://doi.org/10.1890/150063, 2015. https://doi.org/10.5194/gmd-9-1937-2016, 2016. Ito, A., Hajima, T., Lawrence, D. M., Brovkin, V., Delire, C., Falge, E., Baldocchi, D., Tenhunen, J., Aubinet, M., Bakwin, P., Guenet, B., Jones, C. D., Malyshev, S., Materia, S., McDermid, Berbigier, P., Bernhofer, C., Burba, G., Clement, R., Davis, K. S. P., Peano, D., Pongratz, J., Robertson, E., Shevliakova, E., J., Elbers, J. A., Goldstein, A. H., Grelle, A., Granier, A., Guð- Vuichard, N., Wårlind, D., Wiltshire, A., and Ziehn, T.: Soil car- mundsson, J., Hollinger, D., Kowalski, A. S., Katul, G., Law, bon sequestration simulated in CMIP6-LUMIP models: impli- B. E., Malhi, Y., Meyers, T., Monson, R. K., Munger, J. W., cations for climatic mitigation, Environ. Res. Lett., 15, 124061, Oechel, W., Paw U, K. T., Pilegaard, K., Rannik, Ü., Rebmann, https://doi.org/10.1088/1748-9326/abc912, 2020. C., Suyker, A., Valentini, R., Wilson, K., and Wofsy, S.: Sea- Jeong, S.-J., Bloom, A. A., Schimel, D., Sweeney, C., Parazoo, N. sonality of ecosystem respiration and gross primary production C., Medvigy, D., Schaepman-Strub, G., Zheng, C., Schwalm, C. as derived from FLUXNET measurements, Agr. Forest Meteo- R., Huntzinger, D. N., Michalak, A. M., and Miller, C. E.: Accel- rol., 113, 53–74, https://doi.org/10.1016/S0168-1923(02)00102- erating rates of Arctic carbon cycling revealed by long-term at- 8, 2002. mospheric CO2 measurements, Science Advances, 4, eaao1167, Fisher, J. B., Sikka, M., Oechel, W. C., Huntzinger, D. N., Melton, J. https://doi.org/10.1126/sciadv.aao1167, 2018. R., Koven, C. D., Ahlström, A., Arain, M. A., Baker, I., Chen, J. Koven, C. D., Ringeval, B., Friedlingstein, P., Ciais, P., M., Ciais, P., Davidson, C., Dietze, M., El-Masri, B., Hayes, D., Cadule, P., Khvorostyanov, D., Krinner, G., and Tarnocai, Huntingford, C., Jain, A. K., Levy, P. E., Lomas, M. R., Poulter, C.: Permafrost carbon-climate feedbacks accelerate global B., Price, D., Sahoo, A. K., Schaefer, K., Tian, H., Tomelleri, E., warming, P. Natl. Acad. Sci. USA, 108, 14769–14774, Verbeeck, H., Viovy, N., Wania, R., Zeng, N., and Miller, C. E.: https://doi.org/10.1073/pnas.1103910108, 2011. Carbon cycle uncertainty in the Alaskan Arctic, Biogeosciences, Lara, M. J., Nitze, I., Grosse, G., Martin, P., and McGuire, 11, 4271–4288, https://doi.org/10.5194/bg-11-4271-2014, 2014. A. D.: Reduced arctic tundra productivity linked with land- Friedlingstein, P., Meinshausen, M., Arora, V. K., Jones, C. D., form and climate change interactions, Sci. Rep.-UK, 8, 2345, Anav, A., Liddicoat, S. K., and Knutti, R.: Uncertainties in https://doi.org/10.1038/s41598-018-20692-8, 2018. CMIP5 Climate Projections due to Carbon Cycle Feedbacks, Lawrence, D. M., Fisher, R. A., Koven, C. D., Oleson, K. W., J. Climate, 27, 511–526, https://doi.org/10.1175/JCLI-D-12- Swenson, S. C., Bonan, G., Collier, N., Ghimire, B., Kampen- 00579.1, 2014. hout, L. van, Kennedy, D., Kluzek, E., Lawrence, P. J., Li, F., Friedlingstein, P., O’Sullivan, M., Jones, M. W., Andrew, R. M., Li, H., Lombardozzi, D., Riley, W. J., Sacks, W. J., Shi, M., Hauck, J., Olsen, A., Peters, G. P., Peters, W., Pongratz, J., Sitch, Vertenstein, M., Wieder, W. R., Xu, C., Ali, A. A., Badger, https://doi.org/10.5194/esd-14-1-2023 Earth Syst. Dynam., 14, 1–16, 2023
You can also read


